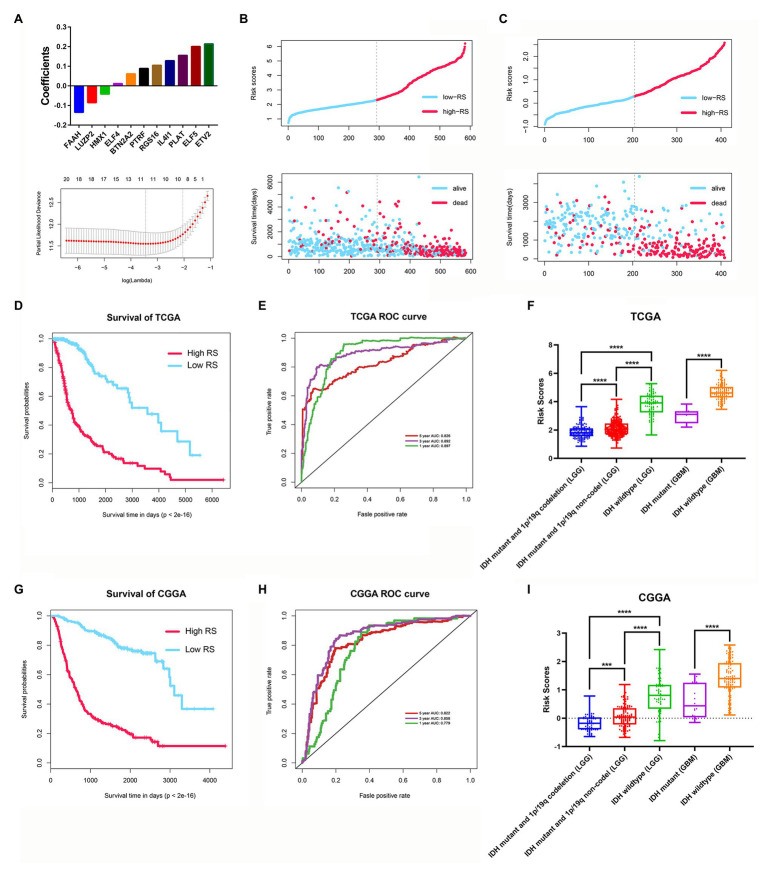
Figure 9.
Construction and validation of the stemness subtype-related risk score model. (A) The 11 genes were selected by least absolute shrinkage and selection operator (LASSO) Cox analysis in TCGA dataset. Risk scores and living status for each patient in the training cohort (B) and the validation cohort (C). (D) Kaplan-Meier curves of the OS of each patient in the training cohort. (E) Time-dependent ROC curve analysis of the risk score model in the training cohort (TCGA dataset). (F) The risk score distributions in different molecular subtypes of glioma (TCGA dataset). (G) Kaplan-Meier curves of the OS of each patient in the validation cohort (CCGA dataset). (H) Time-dependent ROC curve analysis of the risk score model in the validation cohort (CCGA dataset). (I) The risk score distributions in different molecular subtypes of glioma (CGGA dataset). ***p < 0.001 and ****p < 0.0001.

