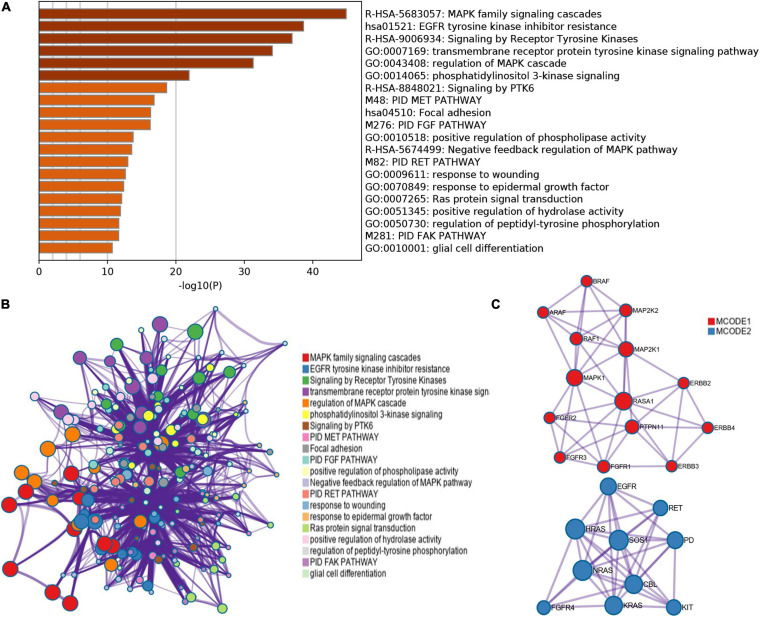
FIGURE 4.
GO and KEGG analysis of ERBB receptor family (Metascape). (A) Bar graph of enriched terms across these enriched genes in patients with cutaneous melanoma, colored by p-values. (B,C) A network of enriched terms: (B) colored by cluster-ID, where nodes that share the same cluster-ID are typically close to each other; (C) Protein–protein interaction network and MCODE components identified in the genes enriched in patients with cutaneous melanoma.

