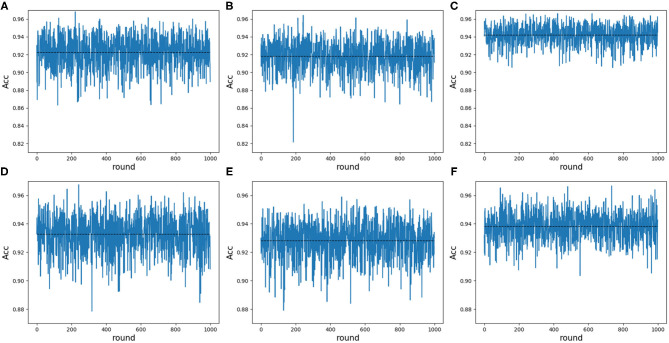
Figure 10.
Line charts of ACC values in 25 dimensions including and excluding variable 10 on 188D and PAAC. The black dotted line refers to the average ACC values of 1,000 rounds. (A) Shows the ACC values of any 25 dimensional feature randomly extracted from 188D in each round of 1,000 times negative sample extraction. (B) Illustrates the ACC values of any 25 dimensional feature randomly extracted from 188D after excluding variable 10 in each round of 1,000 times negative sample extraction. (C) Shows the ACC values of any 25 dimensional feature including variable 10 that is randomly extracted from 188D in each round of 1,000 times negative sample extraction. (D) Shows the ACC values of any 25 dimensional feature randomly extracted from PAAC in each round of 1,000 times negative sample extraction. (E) Illustrates the ACC values of any 25 dimensional feature randomly extracted from PAAC after excluding variable 10 in each round of 1,000 times negative sample extraction. (F) Shows the ACC values of any 25 dimensional feature including variable 10 that is randomly extracted from PAAC in each round of 1,000 times negative sample extraction.

