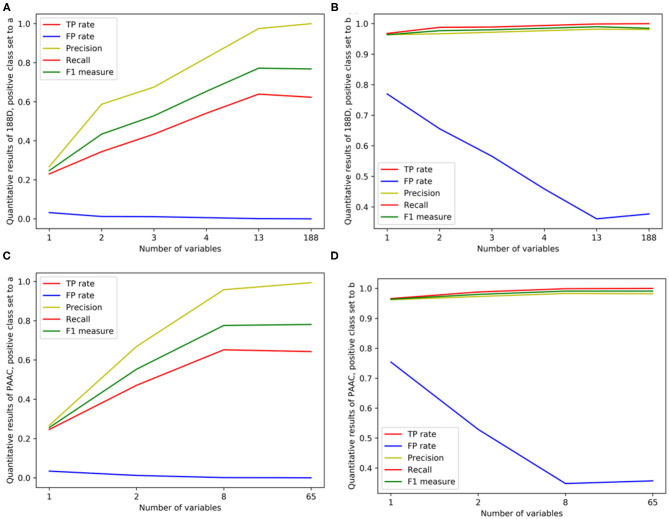
Figure 4.
Line charts of quantitative results on 188D and PAAC, with the x axis representing the number of selected variables. (A,B) Quantitative results on 188D with the positive class set to a and b, respectively. (C,D) Quantitative results on PAAC with the positive class set to a and b, respectively.

