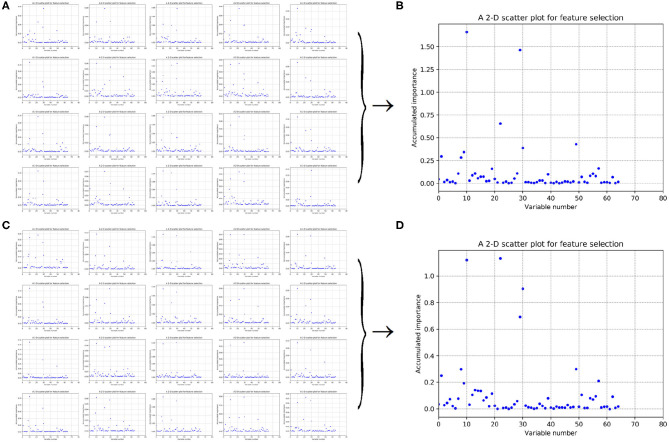
Figure 6.
Scatter plots derived from feature PAAC, each of which keeps x and y axis representing variable and its importance score, respectively. (A,C) Correspond to 20-fold sample split from twice random generations of the training samples. (B,D) Refer to the accumulated results of the 20-fold scatter plots in (A,C), respectively.

