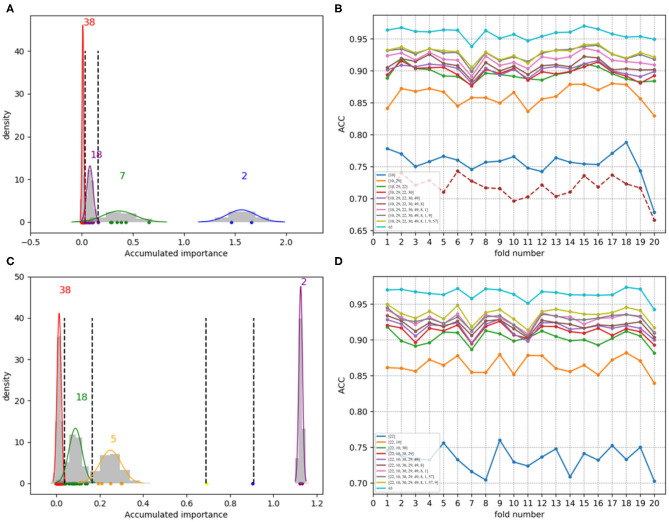
Figure 8.
Qualitative results on low-redundant dataset using PAAC. (A,C) Gaussian distributions of the accumulated variable importance corresponding to twice random sample splits, respectively. (B,D) Refer to ACC line charts of different dimensions derived from feature PAAC, with important variables incrementally added one by one according to the accumulated scores in a descending order.

