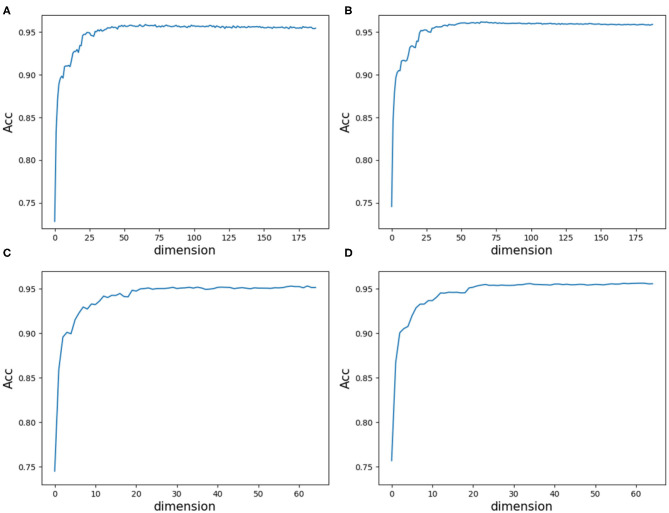
Figure 9.
Line charts of the average ACC values with increasing feature dimensions following the order of the variable importance. (A) Is the line chart derived from the average of 20-fold cross validation using 188D. (B) Is the line chart derived from the average of 1,000 times equal resampling on negative samples from a testing set compared with the number of positive samples on the testing set using 188D. (C) Is the line chart derived from the average of 20-fold cross validation using PAAC. (D) Is the line chart derived from the average of 1,000 times equal resampling on negative samples from a testing set compared with the number of positive samples on the testing set using PAAC.

