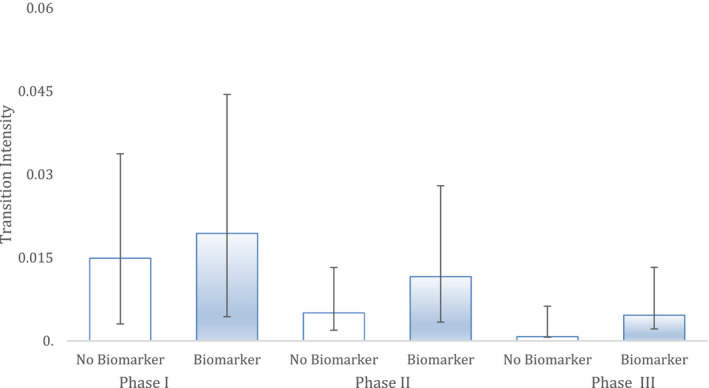
FIGURE 2.

Breast cancer. The ability of two different Markov models to predict clinical trial successes in historical data in this indication. 'Biomarker' shows the performance of a Markov model with biomarker status as a covariate while non‐biomarker has no such covariate. Hazard represents the likelihood and rate of advancing to the next phase. Bars are 95% CI. Sample sizes: Phase I (n = 183), Phase II (n = 132) and Phase III (n = 49).
