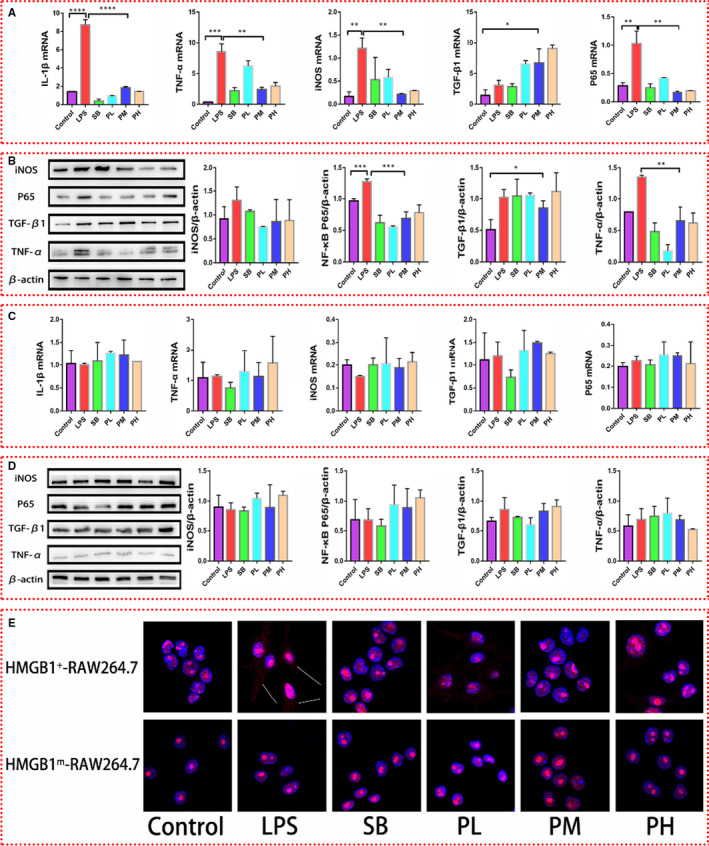
Figure 4.

Influence of paeonol on the inflammatory response in HMGB1+ RAW264.7 and HMGB1m RAW264.7 cells. A, The mRNA levels of IL‐1β, TNF‐α, iNOS, TGF‐β1 and P65 in HMGB1+ RAW264.7 cells were measured by using RT‐qPCR. B, The protein levels of IL‐1β, TNF‐α, iNOS, TGF‐β1 and P65 in HMGB1 + RAW264.7 cells were measured by using Western blotting. C, The relative mRNA expression levels of IL‐1β, TNF‐α, iNOS, TGF‐β1 and P65 in HMGB1m RAW264.7 cells were measured by using RT‐qPCR. D, The protein levels of IL‐1β, TNF‐α, iNOS, TGF‐β1 and P65 in HMGB1m RAW264.7 cells were measured by using Western blotting. E, HMGB1 was stained red, and nuclei were stained blue. HMGB1 in the cytoplasm is indicated with white arrows. The bar graphs are representative of three independent experiments. *P < .05, ** P < .01 and *** P < .001
