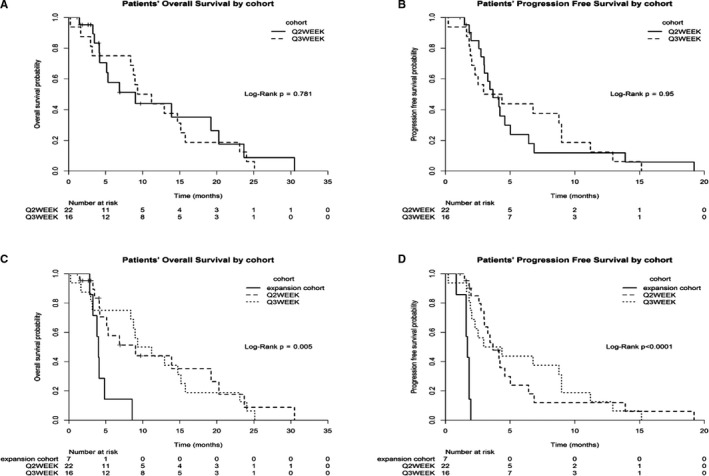
Figure 3.

Kaplan‐Meier plots for dose escalation cohorts (Q2‐week and Q3‐week temsirolimus and capecitabine treatment) associated with patient overall survival (A) and progression‐free survival (B), and for both dose escalation (Q2‐week and Q3‐week temsirolimus and capecitabine) and oxaliplatin expansion cohorts associated with patients' overall survival (C) and progression‐free survival (D)
