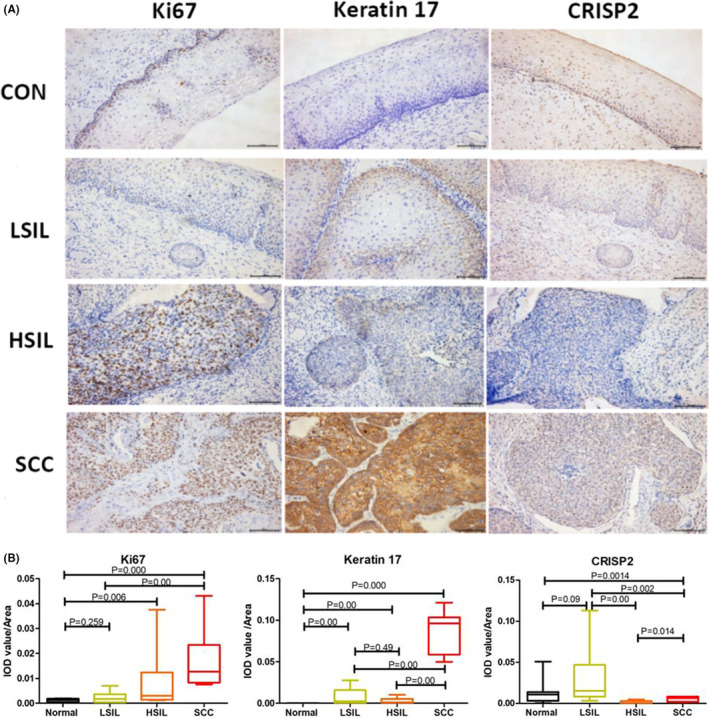
FIGURE 4.

Representative immunohistochemical (IHC) staining (A) and semiquantitative analysis (B) of Ki67, KRT17 and CRISP2 during carcinogenesis. Bar scale: 50 μm. IHC results are presented with IOD value/area in different groups. The Kruskal–Wallis rank test was performed on the IHC results and p < 0.05 was regarded as statistically significant
