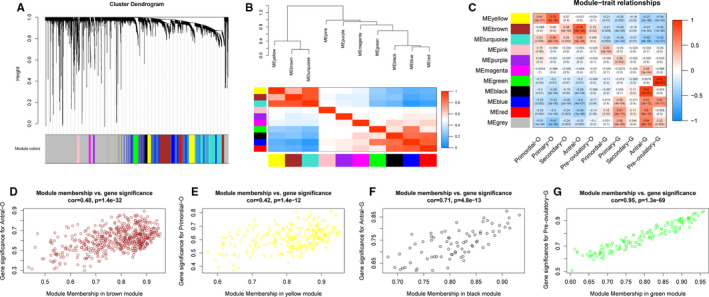
FIGURE 1.

Construction of gene correlation modules. A, The clustering dendrograms of genes. Each gene is represented by one branch, and ten co‐expression modules were constructed and are represented by different colours. B, The eigengene dendrogram and heat map identify groups of correlated eigengenes cross modules. C, Module‐trait relationships. Each row presents a module eigengene, and columns indicate cell type. The corresponding correlation and P value have been marked out. D, Scatter plots of module membership vs. gene significance in brown, yellow, black and green modules
