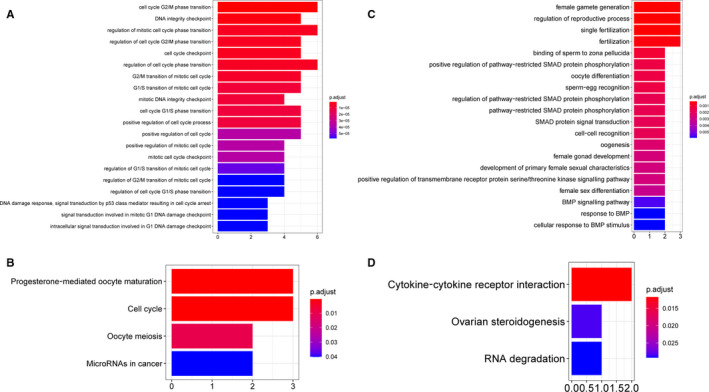
FIGURE 5.

Enrichment analysis of two subnetwork genes. A, Top 20 GO enrichment analysis results of the blue subnetwork genes. B, KEGG enrichment analysis results of the blue subnetwork genes. C, Top 20 GO enrichment analysis results of the red subnetwork genes. D, KEGG enrichment analysis results of the red subnetwork genes
