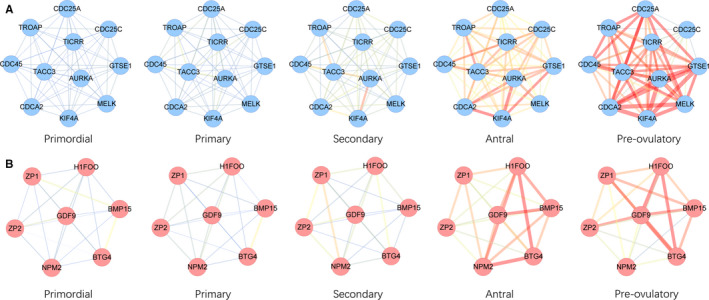
FIGURE 6.

CSN construction among two pivotal subnetworks. A, CSN of the blue subnetwork. Edge colour represents mean connection score in each cell type from blue (low) to red (high). B, CSN of the red subnetwork. Edge colour represents mean connection score in each cell type from blue (low) to red (high)
