FIGURE 4.

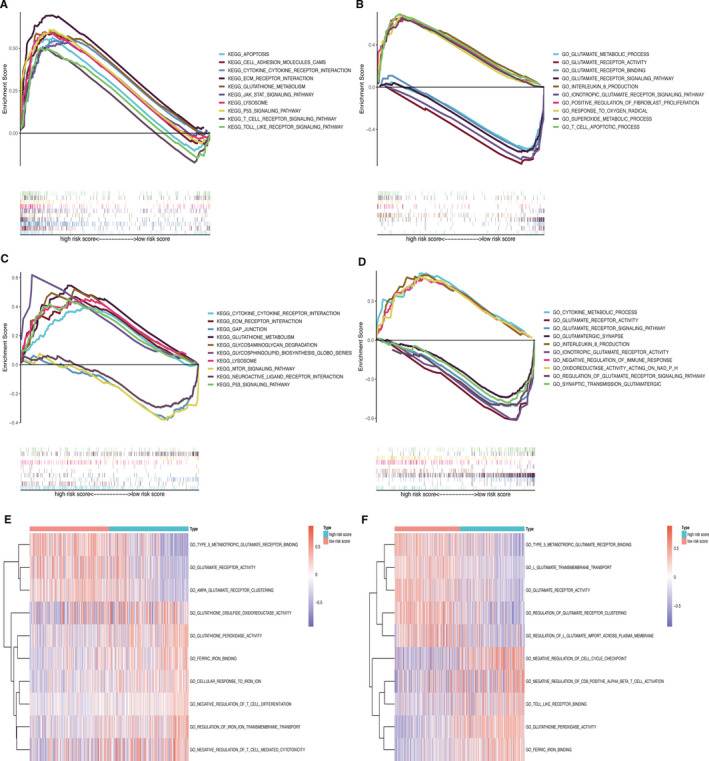
GSEA and GSVA for functional enrichment. (A–B) GSEA between low‐ and high‐risk groups in TCGA. (C–D) GSEA between low‐ and high‐risk groups in CGGA. (E–F) GSVA to assess the differences in pathways between different groups in TCGA and CGGA

GSEA and GSVA for functional enrichment. (A–B) GSEA between low‐ and high‐risk groups in TCGA. (C–D) GSEA between low‐ and high‐risk groups in CGGA. (E–F) GSVA to assess the differences in pathways between different groups in TCGA and CGGA