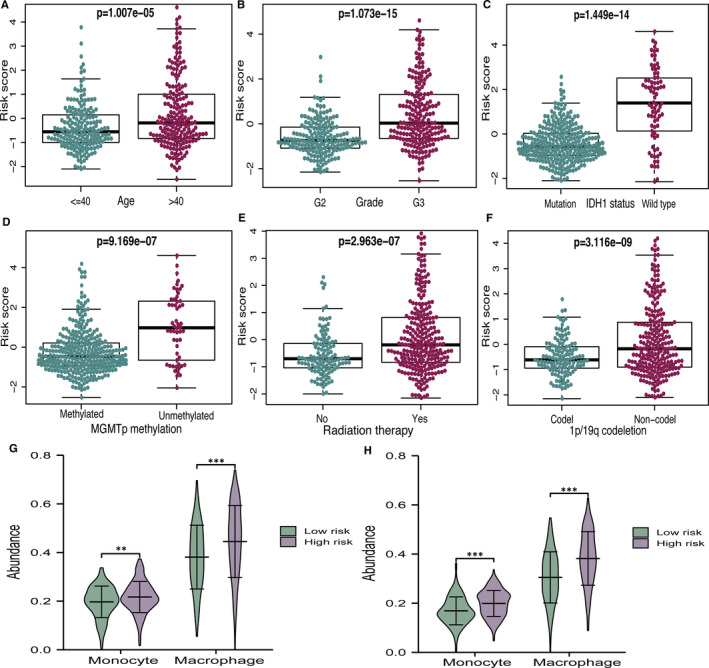
FIGURE 6.

Relationship of risk score with different clinical features and immune cell infiltration. (A‐F) The correlations between risk score and different clinical features. (G–H) The differences between macrophage and monocyte infiltration in TCGA and CGGA
