FIGURE 3.

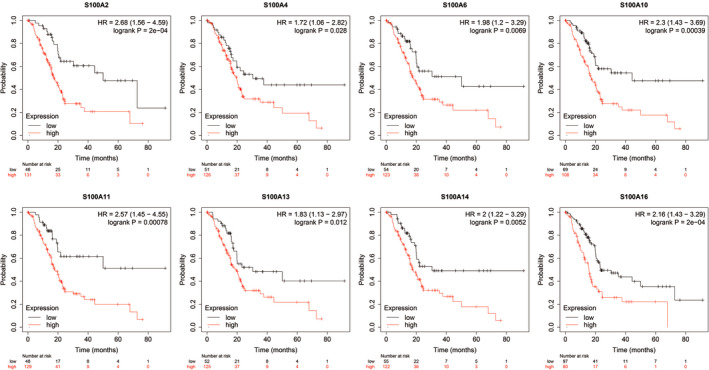
The survival curve for OS of the differentially expressed S100A family members in the KM plotter database. OS, overall survival; KM, Kaplan‐Meier

The survival curve for OS of the differentially expressed S100A family members in the KM plotter database. OS, overall survival; KM, Kaplan‐Meier