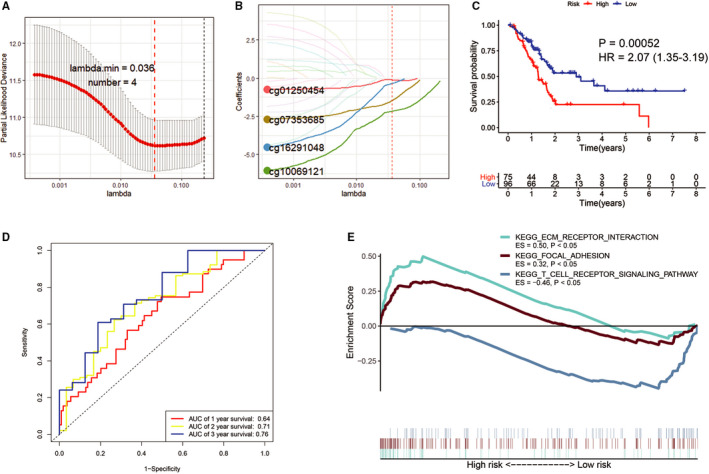
FIGURE 7.

Establishment of A prognostic signature based on four critical CpGs. (A and B, Laoss regression analysis identified four critical CpGs to establish a prognostic signature for OS of PC. C, KM survival curves demonstrated that the low‐risk group displayed a significantly favourable OS than the high‐risk group. D, ROC curve analysis of the signature for 1‐, 2‐ and 3‐year OS prediction of PC patients. E, GSEA demonstrated that ECM‐receptor interaction and focal adhesion‐related gene sets were enriched in the high‐risk group, whereas T cell receptor signalling pathway‐related gene set were enriched in the low‐risk group
