
FIGURE 1.
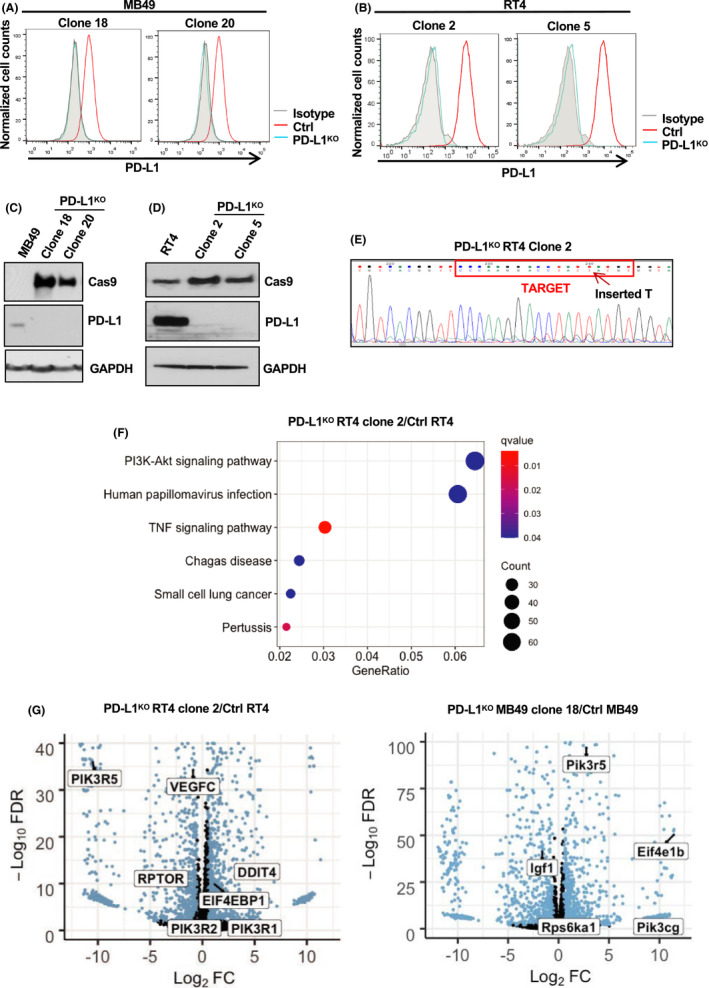
BC cell PD‐L1 expression and PD‐L1KO clones. PD‐L1 was knocked out of BC cell lines by CRISPR/Cas9 and validated using flow cytometry staining (A, B), western blot (C, D), and DNA sequencing (E) of the PD‐L1 Cas9 insertion region. RNA‐seq from PD‐L1KO and control cells grown in vitro. (F) Top KEGG‐enriched pathways in PD‐L1KO compared to control cells. N = 3 biologically independent, sequenced samples per group. Dot size indicates the counts of differentially expressed genes enriched per pathway and color indicates q‐value. (G) Volcano plots of differentially expressed genes depicting key genes involved in mTOR signaling pathway. KEGG, Kyoto Encyclopedia of Genes and Genomes. FDR, false discovery rate. FC, fold change