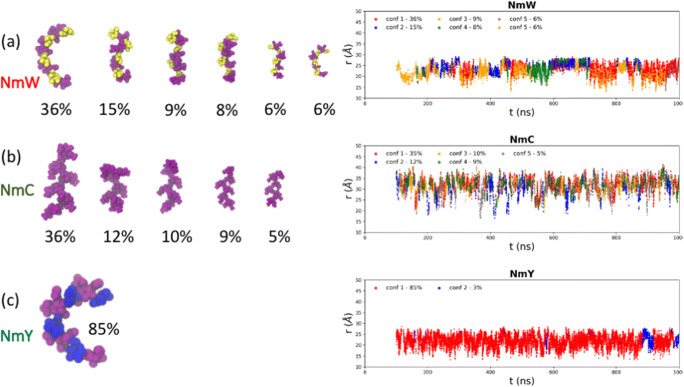
Fig. 2.
Conformational families calculated for each of the Nm antigens, listed in order of saccharide loading. a NmW, b NmC and c NmY. The percentage frequency of each conformational family is shown, with families comprising less than 5 % of the simulation (post-equilibration) excluded. The percentage frequency of each cluster was calculated as fraction of the number of frames in the cluster relative to the total number of frames in the simulation data set (excluding the first 100 ns as equilibration). The left column shows the corresponding time series of the end-to-end distance (r) for each antigen, colored according to the conformational family adopted at each time step. Sugar residues are colored according to identity: α-D-NeupNAc purple, α-D-Galp yellow and α-D-Glcp blue

