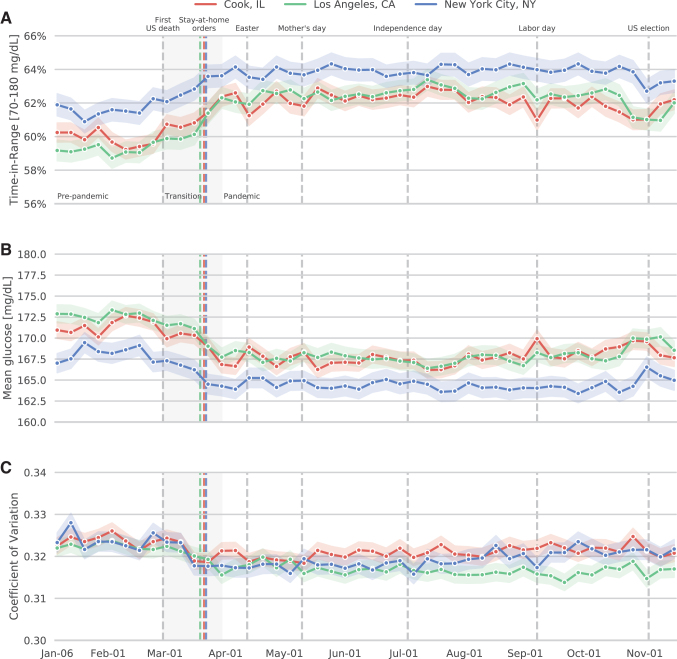
FIG. 2.
Mean (±SEM) proportions of TIR, glucose values, and glycemic variability in early 2020. Red, Cook County, Illinois; green, Los Angeles County, California; blue, New York City, New York. Vertical lines indicate the first U.S. death attributed to coronavirus disease 2019 (initially given as February 29), issuance of region-specific stay-at-home orders (Cook: March 21; New York: March 22; Los Angeles: March 19), Easter (April 12), Mother's Day (May 10), Independence Day (July 4), Labor Day (September 7), and the U.S. election (November 3). The shaded transition period extends from February 29 to March 30. (A) TIR; (B) Sensor glucose; (C) Coefficient of variation. SEM, standard error of the mean.

