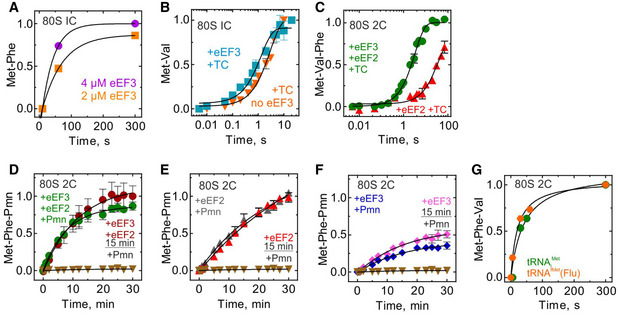
Figure EV1. Di‐ and tripeptide formation.

-
ATime courses of MetPhe formation at different eEF3 concentrations. Data are normalized to Met‐Phe formation in the presence of 4 µM eEF3 with the maximum value in the dataset set to 1.
-
BMet‐Val formation monitored upon rapidly mixing initiation complexes (80S IC; 1 µM) with ternary complexes eEF1A–GTP–[14C]Val‐tRNAVal (0.2 µM) in the presence (cyan, 0.78 ± 0.1/s) or absence (orange, 0.34 ± 0.03/s) of eEF3 in a quench‐flow apparatus, and the extent of peptide formation was analyzed by HPLC and radioactivity counting. Data are normalized to Met‐Val formation in the presence of eEF3 with the maximum value in the dataset set to 1. Data presented as mean ± SEM of n = 3 biological replicates.
-
CMet‐Val‐Phe formation upon rapid mixing of 80S complexes carrying MetVal‐tRNAVal (80S 2C) with ternary complexes eEF1A–GTP–[14C]Phe‐tRNAPhe in the presence of eEF2 and eEF3 (green, 0.3 ± 0.02/s), eEF2 (red, 0.03 ± 0.006/s). Data are normalized to Met‐Val‐Phe formation in the presence of eEF2 and eEF3 with the maximum value in the dataset set to 1. Data presented as mean ± SEM of n = 3 biological replicates.
-
D–FComparison of time courses of 80S 2C reaction with Pmn. 80S 2C complexes with MetPhe‐tRNAPhe in the presence of eEF2 and eEF3 (D), eEF2 (E) or eEF3 (F), or in the absence of eEF2 and eEF3 (brown triangles), with Pmn in a quench‐flow apparatus. As indicated, the reaction was started either by mixing all components, or by addition of Pmn to a mixture of 80S 2C with the factors preincubated for 15 min. The extent of MetPhe‐Pmn formation was analyzed by HPLC and radioactivity counting. Data are normalized to Met‐Phe‐Pmn formation in the presence of eEF2 and eEF3 (D), eEF2, (E) or eEF3 (F) with the maximum value in the dataset set to 1. Data presented as mean ± SEM of n = 3. For comparison, data from Fig 2B are plotted.
-
GMet‐Phe‐Val formation upon rapid mixing of 80S complexes carrying either [3H]Met‐tRNAi Met (green) or [3H]Met‐tRNAfMet(flu) (orange) MetPhe‐tRNAPhe (80S 2C) with ternary complexes eEF1A–GTP–[14C]Val‐tRNAVal in the presence of eEF2 and eEF3. Data are normalized to Met‐Phe‐Val formation in the presence of non‐labeled initiator tRNA (green) with the maximum value in the dataset set to 1.
Source data are available online for this figure.
