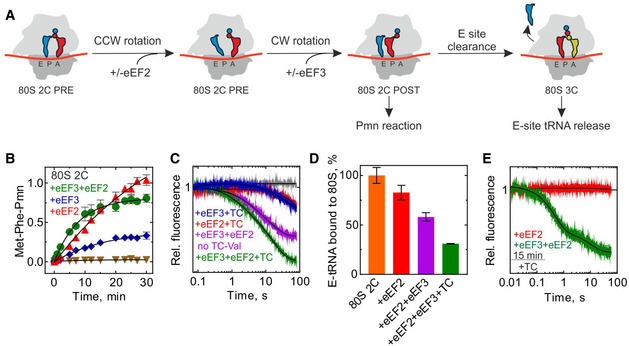
Figure 2. eEF3 in tRNA movement during translocation and E‐site clearance.

- Schematic of tRNA translocation.
- mRNA–tRNA translocation monitored in a time‐resolved Pmn assay upon mixing 80S 2C with Pmn in the absence (brown triangles) or presence of eEF2 and eEF3 (green, 0.13 ± 0.01/min), eEF2 (red, 0.030 ± 0.005/min), or eEF3 (blue, 0.10 ± 0.01/min). Data are normalized to Met‐Phe‐Pmn formation in presence of eEF2 with the maximum value set to 1. Data presented as mean ± SEM of n = 3.
- Dissociation of deacylated tRNA from the E site by the fluorescence change of tRNAfMet(Flu) upon rapidly mixing of 80S 2C with buffer (gray), or with ternary complexes eEF1A–GTP–[14C]Val‐tRNAVal in the presence of eEF2 and eEF3 (green), eEF2 (red), eEF3 (blue), or eEF2 and eEF3 without the ternary complex (magenta) in a stopped‐flow apparatus. Each trace is an average of 5–7 individual time courses and normalized at 1 for the fluorescence at the start of the reaction.
- tRNAfMet(Flu) co‐eluting with 80S 2C incubated without factors (orange), with eEF2 (red), with eEF2 and eEF3 (magenta), or with eEF2, eEF3, and TC‐Val (green) for 15 min before loading on a BioSuite 450 size‐exclusion column to separate ribosome‐bound and ribosome‐unbound tRNA. Data are normalized to tRNAfMet(Flu) bound to 80S 2C in the absence of eEF2/eEF3 with the maximum value set to 100%. Data presented as mean ± SEM of n = 3.
- Dissociation of tRNAfMet(Flu) from 80S 2C deacylated tRNA incubated with eEF2 and eEF3 (green) or eEF2 (red) for 15 min before adding with ternary complexes. Each trace is an average of 5–7 individual time courses and normalized at 1 for the fluorescence at the start of the reaction.
Source data are available online for this figure.
