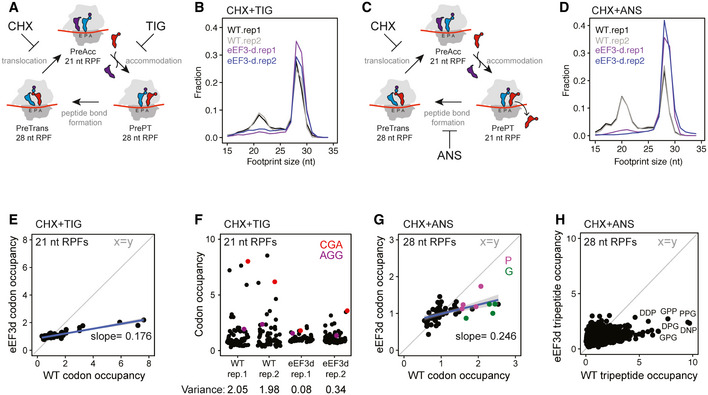
Schematic representation of the eukaryotic elongation cycle with ribosome footprint sizes to illustrate the functional states isolated by CHX + TIG. PreAcc, pre‐accommodation; PrePT, pre‐peptide bond formation; PreTrans, pre‐translocation.
Size distributions of ribosome footprints for WT (black and gray) and eEF3d (purple and blue) cells from libraries prepared with CHX + TIG. Two biological replicates are shown.
Similar to (A), with footprint sizes isolated by CHX + ANS.
Similar to (B), from libraries prepared with CHX + ANS.
Scatter plot of codon‐specific ribosome occupancies for 21 nt RPFs comparing eEF3d to WT cells from libraries prepared with CHX + TIG. Trend line (blue) and its slope are shown. The diagonal line indicates the distribution expected for no change.
Codon‐specific ribosome occupancies for 21 nt RPFs from WT and eEF3d cells (two biological replicates). CGA and AGG codons are shown in red and purple, respectively. Variance for each dataset is indicated.
Scatter plot of codon‐specific occupancies for 28 nt RPFs comparing eEF3d to WT cells from libraries prepared with CHX + ANS. Trend line (blue) and its slope are shown. Codons that encode proline and glycine are colored in purple and green, respectively.
28 nt RPF‐ribosome occupancies of 5,771 tripeptide motifs are plotted for WT and eEF3d cells, for motifs more than 100 occurrences in yeast transcriptome. Motif sequences enriched upon eIF5A depletion are labeled.

