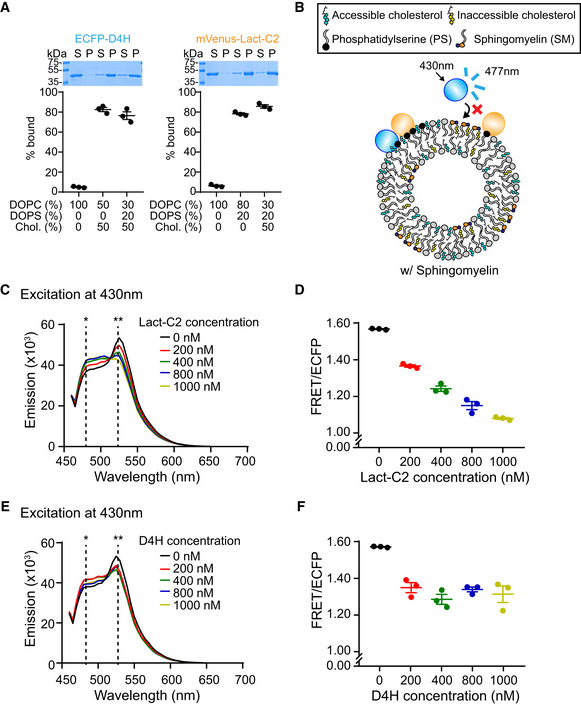
Liposome sedimentation assays of purified ECFP‐D4H proteins (accessible cholesterol biosensor) and purified mVenus‐Lact‐C2 proteins (phosphatidylserine biosensor). Liposomes containing the indicated mole% lipids were incubated with purified proteins as shown. Bound proteins [pellet, (P)] were separated from the unbound proteins [supernatant, (S)], run on SDS–PAGE and visualized by colloidal blue staining (mean ± SEM, n = 3 independent experiments). DOPC, phosphatidylcholine (1,2‐dioleoyl‐sn‐glycero‐3‐phosphocholine); DOPS, phosphatidylserine (1,2‐dioleoyl‐sn‐glycero‐3‐phospho‐L‐serine); Chol., cholesterol. Note that the presence of PS does not affect the binding of ECFP‐D4H to cholesterol‐containing liposomes and that the presence of cholesterol does not affect the binding of mVenus‐Lact‐C2 to PS containing liposomes.
Schematic of the
in vitro FRET assay in the presence of sphingomyelin. Liposomes containing PS, cholesterol, and sphingomyelin were mixed with an accessible cholesterol biosensor (ECFP‐D4H) and a PS biosensor (mVenus‐Lact‐C2). ECFP‐D4H was excited at 430 nm and emission from mVenus‐Lact‐C2 due to FRET between ECFP and mVenus was recorded at 525 nm. The presence of sphingomyelin contributes to sequestration of cholesterol into inaccessible pool, resulting in reduced binding of ECFP‐D4H to liposomes and decrease in FRET as observed in Fig
1B.
Representative emission spectra of mixtures containing ECFP‐D4H, mVenus‐Lact‐C2, and liposomes containing cholesterol (50%), phosphatidylserine (DOPS) (20%), and phosphatidylcholine (DOPC) (30%), with or without untagged Lact‐C2 proteins. Asterisks indicate positions of emission maximum of ECFP (*477 nm) and FRET (**525 nm). Note the decrease of FRET signal at 525 nm and increase of ECFP emission at 480 nm upon addition of increasing amount of untagged Lact‐C2 proteins into the mixture.
Quantification of the ratio of FRET signal at 525 nm to ECFP emission at 480 nm (FRET/ECFP) (see Materials and Methods) from mixtures as shown in (C) (mean ± SEM, n = 3 independent experiments for all conditions).
Representative emission spectra of mixtures containing ECFP‐D4H, mVenus‐Lact‐C2, and liposomes containing cholesterol (50%), phosphatidylserine (DOPS) (20%), and phosphatidylcholine (DOPC) (30%), with or without untagged D4H proteins. Asterisks indicate positions of emission maximum of ECFP (*477 nm) and FRET (**525 nm). Note the decrease of FRET signal at 525 nm and increase of ECFP emission at 480 nm upon addition of increasing amount of untagged D4H proteins into the mixture.
Quantification of the ratio of FRET signal at 525 nm to ECFP emission at 480 nm (FRET/ECFP) (see Materials and Methods) from mixtures as shown in (E) (mean ± SEM, n = 3 independent experiments for all conditions).