-
A
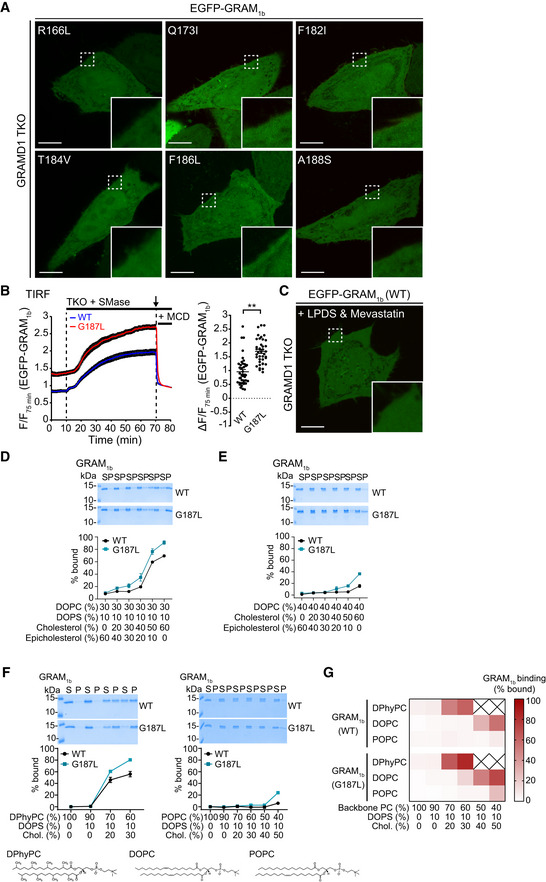
Confocal images of live GRAMD1 TKO HeLa cells expressing mutant versions of EGFP‐tagged GRAM domain of GRAMD1b (EGFP‐GRAM1b) as indicated. Insets show at higher magnification the regions indicated by white dashed boxes. Scale bars, 10 µm.
-
B
Left: Time course of normalized EGFP signal, as assessed by TIRF microscopy, from GRAMD1 TKO (TKO) HeLa cells expressing either wild‐type EGFP‐GRAM1b (WT) or mutant EGFP‐GRAM1b (G187L) as indicated. SMase treatment (100 mU/ml) and methyl‐β‐cyclodextrin (MCD) treatment (5 mM) are indicated. Note that the fluorescence signal was normalized by the value of 75 min time point. Right: Values of ΔF/F75 corresponding to 70 min time point as indicated by the arrow [mean ± SEM, n = 41 cells (WT), n = 40 cells (G187L), data are pooled from two independent experiments for each condition; two‐tailed unpaired Student’s t‐test, **P < 0.0001].
-
C
A confocal image of live GRAMD1 TKO HeLa cells expressing EGFP‐GRAM1b (WT). Cells were cultured in the medium supplemented with 10% lipoprotein‐deficient serum (LPDS) and mevastatin (50 µM) for 16 h before imaging. An inset shows at higher magnification the region indicated by a white dashed box. Note the absence of PM recruitment. Scale bars, 10 µm.
-
D–F
Liposomes containing the indicated mole% lipids were incubated with purified wild‐type GRAM1b (WT) and mutant GRAM1b (G187L) proteins. Bound proteins [pellet, (P)] were separated from the unbound proteins [supernatant, (S)], run on SDS–PAGE and visualized by colloidal blue staining (mean ± SEM, n = 3 independent experiments for all the conditions). DPhyPC, 1,2‐diphytanoyl‐sn‐glycero‐3‐phosphocholine; DOPC, phosphatidylcholine (1,2‐dioleoyl‐sn‐glycero‐3‐phosphocholine); POPC, 1‐palmitoyl‐2‐oleoyl‐glycero‐3‐phosphocholine; DOPS, phosphatidylserine (1,2‐dioleoyl‐sn‐glycero‐3‐phospho‐L‐serine); Chol., cholesterol. Chemical structures of DPhyPC, DOPC, and POPC are shown below (F).
-
G
Both GRAM
1b (WT) and GRAM
1b (G187L) proteins sense cholesterol accessibility. The mean values of liposome binding efficiency of purified GRAM
1b (WT) and GRAM
1b (G187L) proteins as assessed by liposome sedimentation assays in (F) and Fig
6H were presented as a heat map.