
Figure 5. Cholesterol‐sensing property of the GRAM domain is critical for GRAMD1b function.
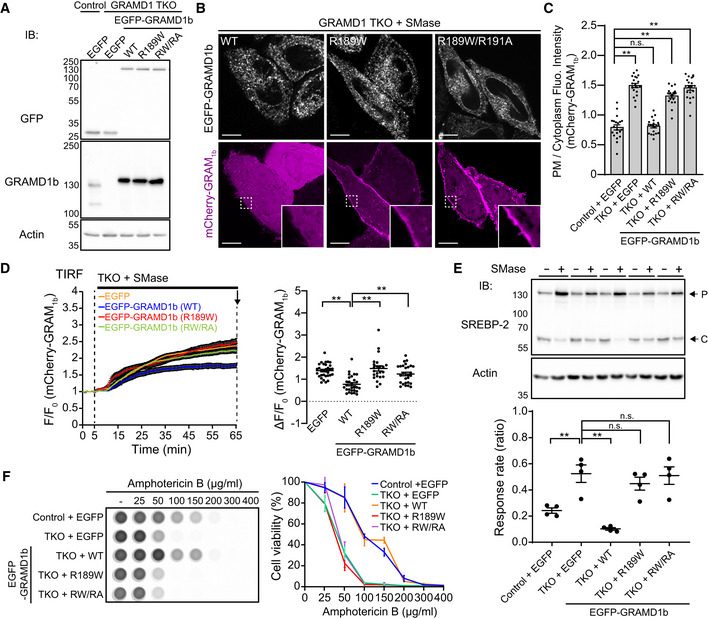
- Lysates of wild‐type (control) and GRAMD1 TKO HeLa cells that stably expressed either EGFP or EGFP‐tagged GRAMD1b (EGFP‐GRAMD1b) constructs as indicated [wild‐type (WT), R189W mutant (R189W), R189W/R191A mutant (RW/RA)] were processed by SDS–PAGE and immunoblotted (IB) with anti‐GFP, anti‐GRAMD1b, and anti‐actin antibodies.
- Confocal images of live GRAMD1 TKO HeLa cells stably expressing EGFP‐GRAMD1b constructs as indicated that were additionally transfected with an accessible PM cholesterol biosensor, mCherry‐tagged GRAM domain of GRAMD1b (mCherry‐GRAM1b). Cells were treated with SMase (100 mU/ml for 1 h at 37°C) before imaging. Insets show at higher magnification the regions indicated by white dashed boxes. Note the very weak PM recruitment of mCherry‐GRAM1b in cells that stably expressed EGFP‐GRAMD1b WT, compared to the strong PM recruitment of mCherry‐GRAM1b in cells that stably expressed EGFP‐GRAMD1b R189W mutant (R189W) or EGFP‐GRAMD1b R189W/R191A mutant (RW/RA). Scale bars, 10 µm.
- Quantification of the ratio of PM mCherry‐GRAM1b signals to the cytosolic mCherry‐GRAM1b signals, as assessed by confocal microscopy and line scan analysis from GRAMD1 TKO (TKO) HeLa cells expressing mCherry‐GRAM1b with SMase treatment (100 mU/ml for 1 h at 37°C) as shown in (B) and Fig EV3B (mean ± SEM, n = 20 cells for each condition; data are pooled from two independent experiments; Dunnett’s multiple comparisons test, **P < 0.0001. n.s. denotes not significant).
- Left: Time course of normalized mCherry signal, as assessed by TIRF microscopy, from GRAMD1 TKO (TKO) HeLa cells stably expressing either EGFP or EGFP‐GRAMD1b constructs as indicated that were additionally transfected with an accessible PM cholesterol biosensor mCherry‐GRAM1b. SMase treatment (100 mU/ml) is indicated. Right: Values of ΔF/F0 corresponding to the end of the experiment as indicated by the arrow [mean ± SEM, n = 31 cells (EGFP), n = 28 cells (EGFP‐GRAMD1b WT), n = 23 cells (EGFP‐GRAMD1b R189W), n = 27 cells [EGFP‐GRAMD1b R189W/R191A (RW/RA)]; data are pooled from two independent experiments for each condition; Dunnett’s multiple comparisons test, **P < 0.0001 (EGFP versus WT and WT versus R189W), **P = 0.0002 (WT versus RW/RA)].
- Wild‐type (control) and GRAMD1 TKO (TKO) HeLa cells that stably expressed either EGFP or EGFP‐GRAMD1b constructs as indicated [wild‐type (WT), R189W mutant (R189W), R189W/R191A mutant (RW/RA)], were cultured in the medium supplemented with 10% lipoprotein‐deficient serum (LPDS) and mevastatin (50 µM) for 16 h and then treated with SMase (100 mU/ml) for 3 h at 37°C. Top: Lysates of the cells were processed for SDS–PAGE and IB with anti‐SREBP‐2 and anti‐actin antibodies. Arrows indicate precursor (P) and cleaved (C) forms of SREBP‐2. Bottom: The response rate was obtained by normalizing the ratio of the band intensity of the cleaved SREBP‐2 over the total band intensity of cleaved and precursor forms of SREBP‐2 from the cells with SMase treatment by the one from the cells without SMase treatment for each condition. Note that the suppression of SREBP‐2 cleavage is attenuated in GRAMD1 TKO HeLa cells compared to wild‐type control HeLa cells. Note also the rescue by expression of wild‐type EGFP‐GRAMD1b (WT) but not by mutant versions of EGFP‐GRAMD1b [R189W, R189W/R191A (RW/RA)] [mean ± SEM, n = 4 lysates (independent experiments) for each condition; Dunnett’s multiple comparisons test, **P = 0.0035 (Control + EGFP versus TKO + EGFP), **P < 0.0001 (TKO + EGFP versus TKO + WT), n.s. denotes not significant].
- Amphotericin B resistance of SMase‐treated wild‐type (control) and GRAMD1 TKO (TKO) HeLa cells that stably expressed either EGFP or EGFP‐GRAMD1b constructs as indicated [wild‐type (WT), R189W mutant (R189W), R189W/R191A mutant (RW/RA)]. Left: Cells that had been pre‐treated with SMase (100 mU/ml) for 3 h at 37°C were treated with indicated concentration of Amphotericin B for 20 min at 37ºC. After overnight recovery in culture media, cell viability was measured by detecting ATP present in each well via luminescence (see Materials and Methods). The same number of cells were seeded in each well before SMase treatment. Note the reduced viability of cells with increasing amount of Amphotericin B. Right: Quantification of cell viability with increasing amount of Amphotericin B. Note the resistance of wild‐type control and GRAMD1 TKO cells that stably expressed EGFP‐GRAMD1b (WT) compared to GRAMD1 TKO cells or GRAMD1 TKO cells that stably expressed mutant versions of EGFP‐GRAMD1b [R189W, R189W/R191A (RW/RA)] (mean ± SEM, n = 3 independent experiments for each condition).
Source data are available online for this figure.