
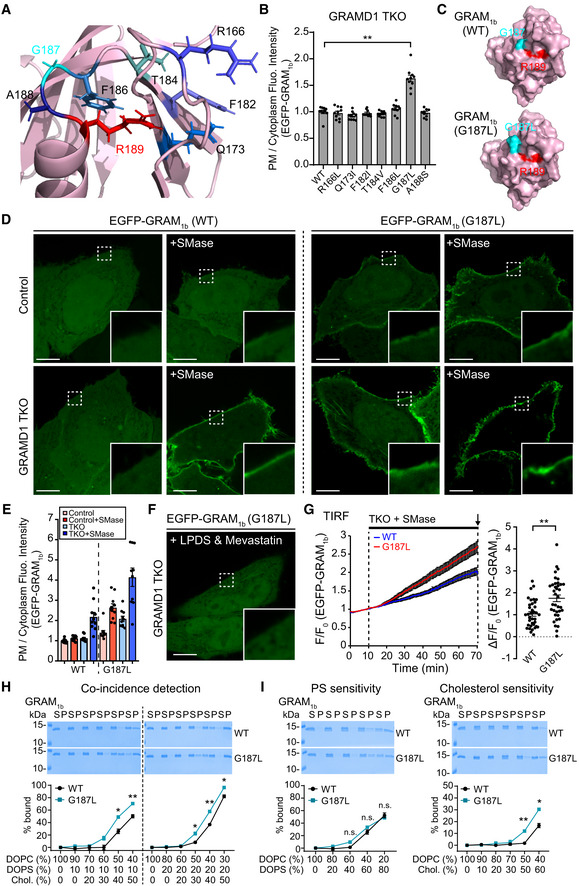
Figure 6. G187L mutation specifically increases the cholesterol sensitivity of the GRAM domain of GRAMD1b.
-
AClose‐up view of the ribbon diagram of the modeled GRAM domain of GRAMD1b (GRAM1b) showing amino acid side chains of R189 and other amino acids, lying in the ~4–14 Å vicinity of R189, that were mutated in mini‐mutagenesis screen as shown in (B).
-
BQuantification of the ratio of PM signals to the cytosolic signals of wild‐type EGFP‐GRAM1b (WT) and mutant versions of EGFP‐GRAM1b (R166L, Q173I, F182I, T184V, F186L, G187L, A188S), as assessed by confocal microscopy and line scan analysis from GRAMD1 TKO HeLa cells, expressing indicated constructs, as shown in (D) and Fig EV4A (mean ± SEM, n = 10 cells for each condition; data are pooled from one experiment; Dunnett’s multiple comparisons test, **P < 0.0001).
-
CSurface representations of the modeled wild‐type GRAM1b (WT) and mutant GRAM1b carrying G187L mutation (G187L) showing the close proximity of G187 (or G187L) and R189 residues.
-
DConfocal images of live wild‐type (control) and GRAMD1 TKO HeLa cells, expressing either wild‐type EGFP‐GRAM1b (WT) or mutant EGFP‐GRAM1b (G187L), with or without SMase treatment (100 mU/ml for 1 h at 37°C). Insets show at higher magnification the regions indicated by white dashed boxes. Note the recruitment of mutant EGFP‐GRAM1b (G187L) to the PM even in wild‐type HeLa cells at rest, which was further enhanced by SMase treatment. Scale bars, 10 µm.
-
EQuantification of the ratio of PM signals to the cytosolic signals of wild‐type EGFP‐GRAM1b (WT) and mutant EGFP‐GRAM1b (G187L), as assessed by confocal microscopy and line scan analysis from GRAMD1 TKO HeLa cells, expressing indicated constructs, with or without SMase treatment (100 mU/ml for 1 h at 37°C), as shown in (D) (mean ± SEM, n = 10 cells for each condition; data are pooled from one experiment).
-
FA confocal image of live GRAMD1 TKO HeLa cells expressing mutant EGFP‐GRAM1b (G187L). Cells were cultured in the medium supplemented with 10% lipoprotein‐deficient serum (LPDS) and mevastatin (50 µM) for 16 h to deplete accessible cholesterol before imaging. An inset shows at higher magnification the region indicated by a white dashed box. Note the absence of PM recruitment (compare to (D)). Scale bars, 10 µm.
-
GTime course of normalized EGFP signal, as assessed by TIRF microscopy, from GRAMD1 TKO (TKO) HeLa cells expressing either wild‐type EGFP‐GRAM1b (WT) or mutant EGFP‐GRAM1b (G187L) as indicated. Cells were cultured in the medium supplemented with 10% lipoprotein‐deficient serum (LPDS) and mevastatin (50 µM) for 16 h before imaging. SMase treatment (100 mU/ml) is indicated. Right: Values of ΔF/F0 corresponding to the end of the experiment as indicated by the arrow [mean ± SEM, n = 36 cells (WT), n = 37 cells (G187L), data are pooled from two independent experiments for each condition; two‐tailed unpaired Student’s t‐test, **P = 0.0003]. Note the rapid PM recruitment of G187L mutant compared to WT. See also Movie EV3.
-
H, ILiposome sedimentation assays of wild‐type GRAM1b (WT) and mutant GRAM1b (G187L). Liposomes containing the indicated mole% lipids were incubated with purified GRAM1b proteins as shown. Bound proteins [pellet, (P)] were separated from the unbound proteins [supernatant, (S)], run on SDS–PAGE and visualized by colloidal blue staining [mean ± SEM, n = 3 independent experiments for all the conditions; (H) Left (10% PS): Holm–Sidak t‐test for multiple comparisons, *P = 0.022679 at 40% cholesterol, **P = 0.009195 at 50% cholesterol. Right (20% PS): Holm–Sidak t‐test for multiple comparisons, *P = 0.023163 at 30% cholesterol, **P = 0.000327 at 40% cholesterol, *P = 0.017194 at 50% cholesterol. (I) Holm–Sidak t‐test for multiple comparisons, n.s. denotes not significant, **P < 0.000001 at 50% DOPC, 50% cholesterol, *P = 0.011271 at 40% DOPC, 60% cholesterol]. DOPC, phosphatidylcholine (1,2‐dioleoyl‐sn‐glycero‐3‐phosphocholine); DOPS, phosphatidylserine (1,2‐dioleoyl‐sn‐glycero‐3‐phospho‐L‐serine); Chol., cholesterol.
Source data are available online for this figure.