
Figure 1. NF‐κB is activated in two distinct phases in response to DNA damage corresponding to anti‐apoptotic and pro‐inflammatory gene programs.
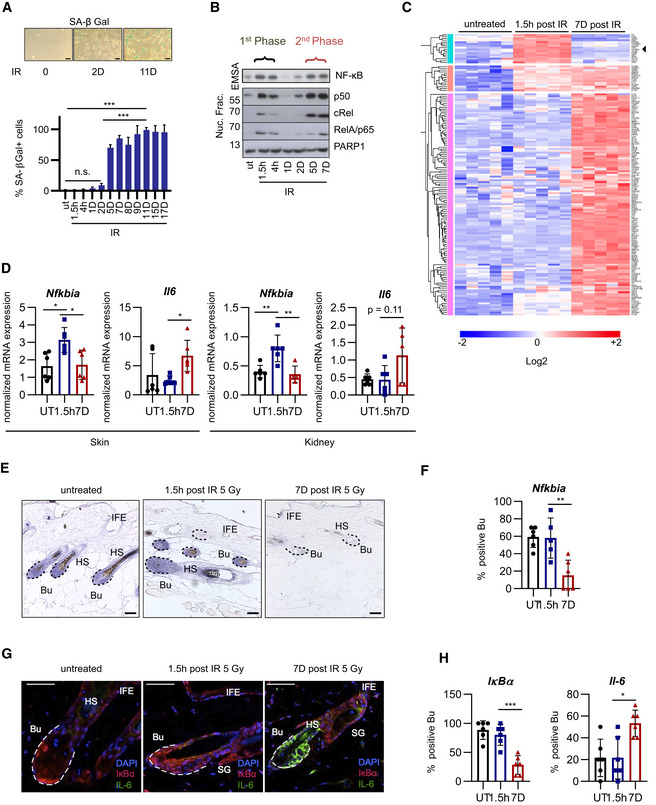
- SA‐β‐gal staining of U2‐OS cells, harvested at indicated times post‐irradiation (IR); h, hours; D, days; UT, untreated. n = 3. Scale bar: 50 μm. Bar graph: Significance was determined by Brown–Forsythe ANOVA with Dunnett’s 3T test, using n = 3 biological replicates. SD shown. ***P < 0.001, n.s., not significant.
- Nuclear fractions from U2‐OS cells were harvested at indicated time points post‐IR (20 Gy) as in (A). Top panel: NF‐κB DNA binding was analyzed by EMSA. Lower panels: Western blot of indicated NF‐κB subunits and PARP1 as loading control. The two phases of nuclear translocation and DNA binding are indicated. Representative gel shown from n = 5 biological replicates.
- Gene expression analysis of two NF‐κB phases following damage. RNA‐seq analysis (n = 5 biological replicates per group) of U2‐OS cells, either untreated or analyzed 1.5 h or 7 days after irradiation (20 Gy), as indicated. The heatmap shows significantly regulated genes (log2 value > 0.5 and P value < 0.05). Black arrow points to NFKBIA. Significance determined by ANOVA with Bonferroni correction for multiple testing. See also Dataset EV1.
- Female mice, 12–16 weeks old (n = 6 mice per condition (with three technical repeats per mouse), were irradiated (5 Gy) and sacrificed after 1 h (first phase), 7 days (second phase) or left untreated. Skin or renal tissue RNA was analyzed by RT–qPCR, shown as a mean ± SD. Significance was confirmed by ANOVA with Tukey multiple comparisons test. SD shown: *P < 0.05, **P < 0.01.
- In situ hybridization using an anti‐sense IκBα/Nfkbia riboprobe on longitudinal skin sections from female mice treated as in (D) for the time indicated. Representative sections shown from n = 6 mice per condition. Bu, bulge region (dashed lines), HS, hair shaft, IFE, interfollicular epidermis. Scale bar: 50 μm.
- Quantitation of (E) from n = 6 mice per condition and 3–4 sections per mouse. Bulge regions positive for Nfkbia were counted and presented as percentage of total. One‐way ANOVA analysis with Tukey multiple comparisons test was performed. SD shown. **P < 0.01.
- Skin sections as in (E) analyzed by immunofluorescence with IκBα (red) or IL‐6 antibody (green) and nuclear DAPI staining (blue). Dotted lines delineate hair follicles, Bu, bulge region, HS, hair shaft, IFE, interfollicular epidermis, SG, sebaceous gland. Scale bar: 50 μm.
- Quantitation of (G) from n = 6 mice per condition and 3–4 sections per mouse. Bulge regions positive for IκBα or IL‐6 were counted and presented as percentage of total. One‐way ANOVA analysis with Tukey multiple comparisons test was performed. SD shown. *P < 0.05, ***P < 0.001.
Source data are available online for this figure.