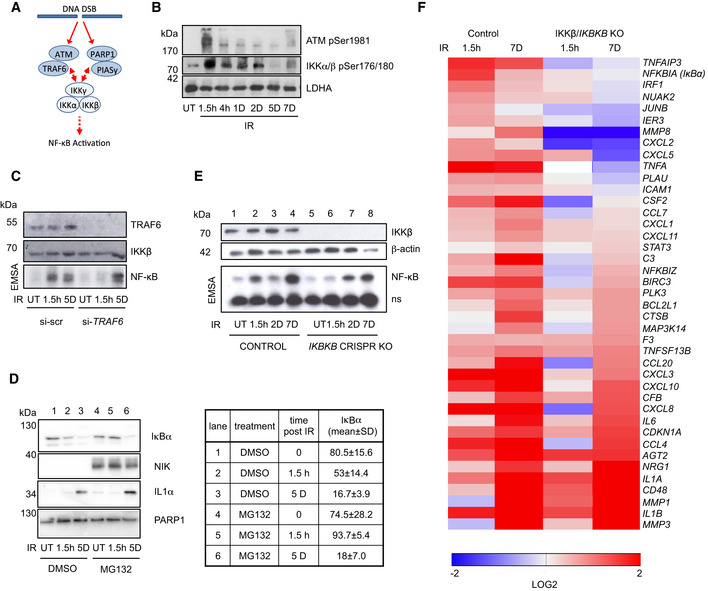
Figure 5. The second phase is IKK‐ and proteasome‐independent.

- SDS–PAGE Western blot of whole cell lysates of U2‐OS cells irradiated (20 Gy) at time points indicated prior to harvest. ut, untreated. LDHA. Representative gel shown from n = 4 biological replicates.
- U2‐OS cells transfected with TRAF6 siRNA or scrambled control siRNA and TRAF6 and IKKβ levels analyzed by Western blotting (top panels). NF‐κB activity was determined by EMSA in untreated cells (ut) and after IR at indicated time points (lower panel). ns, unspecific band. Representative gels are shown from n = 2 biological replicates.
- U2‐OS cells were exposed to IR at indicated time points prior to harvest and analyzed by Western blotting for levels of IκBα, NIK, IL‐1α, and PARP1. Treatment with proteasomal inhibitor MG132 (10 μM) started 4 h prior to harvest. NIK serves as positive control for efficient proteasome inhibition. Quantitation from n = 4 biological replicates and SD is shown for IκBα (right panel). Brown–Forsythe ANOVA test: P = 0.0005.
- U2‐OS CRISPR IKBKB knockout and control cell lines were irradiated (20 Gy) and harvested at indicated time points. NF‐κB activity was analyzed by EMSA (lower panel). ns indicates an non‐specific band. Upper panel, Western blot analysis of actin and IKKβ. Representative gels shown from n = 3 replicates.
- Irradiated U2‐OS control and IKBKB knockout cells (as above) were analyzed by RT–qPCR at the time points indicated for expression of NF‐κB target genes identified by RNA‐seq (Dataset EV1). Significantly regulated targets, cutoff set at P = 0.05 (as determined by ANOVA with Tukey multiple comparison), are shown.
Source data are available online for this figure.
