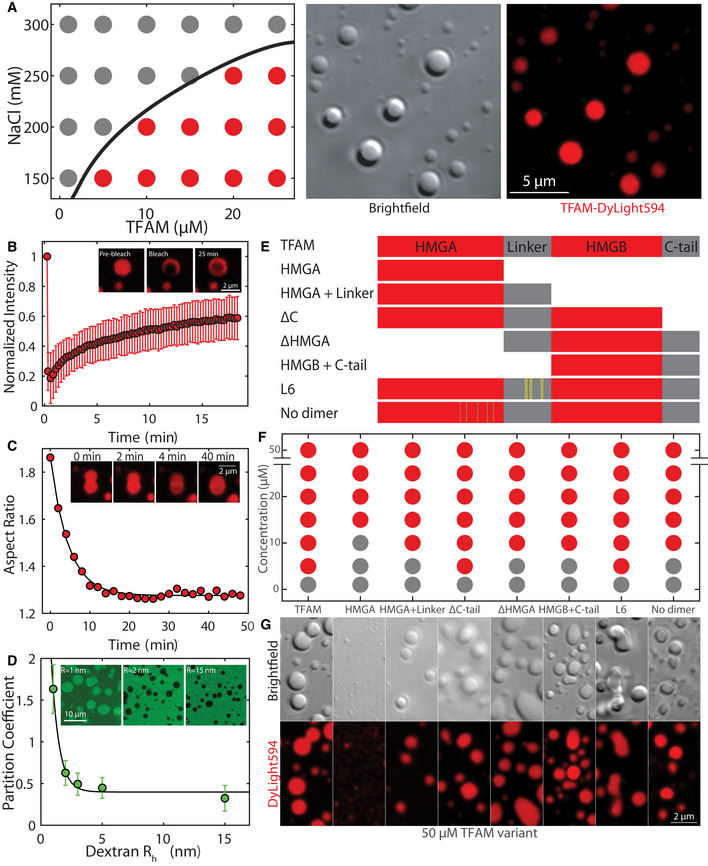
Phase diagram (left panel) of TFAM under various protein and salt concentrations, where gray dots indicate single/soluble phase, red dots signify two phases/droplets present. DIC image (middle) and maximum intensity projection (right) of TFAM‐DyLight‐594 droplets at 25 µM and 150 mM NaCl in 20 mM Tris–HCl, pH 7.5 30 min after mixing. Scale bar = 5 µm.
FRAP using 488 and 561 nm light performed on a ~1 µm spot on TFAM droplet 30 min after mixing. Inset shows representative fluorescent image of TFAM‐DyLight‐594 pre‐bleach, immediately post‐bleach, and 25 min post‐bleach. Scale bar = 2 µm. Values represent averages ± SD from n = 15 droplets.
Aspect ratio of droplet shape as a function of time after contact for a representative droplet. Inset shows fusion images corresponding to the trace at t = 0, 2, 4, and 40 min. Scale bar = 2 µm.
The partition coefficient of dextran‐FITC into TFAM droplets as a function of dextran average hydrodynamic radius estimated from the molecular weight. Solid line is an exponential fit to the data, where the partition coefficient is giving rise to nm. Inset shows representative images showing localization of dextran‐FITC for Rh ≈ 1, 2 and 25 nm. Scale bar = 10 µm. Values represent averages ± SD from n = 3 experiments (>20 droplets analyzed per condition for each experiment).
Schematic diagram of mutants with HMG domains in red and intrinsically disordered regions in gray. Yellow and green lines indicate point mutations in L6 and no‐dimer mutants, respectively.
Phase diagram of mutants at 150 mM NaCl and 20 mM Tris–HCl, pH 7.5 for a range of protein concentrations.
Fluorescent maximum intensity projections of mutants at 50 µM protein and 150 mM NaCl, 20 mM Tris–HCl, pH 7.5 within 30–60 min after mixing. Scale bar = 2 µm.

