-
A
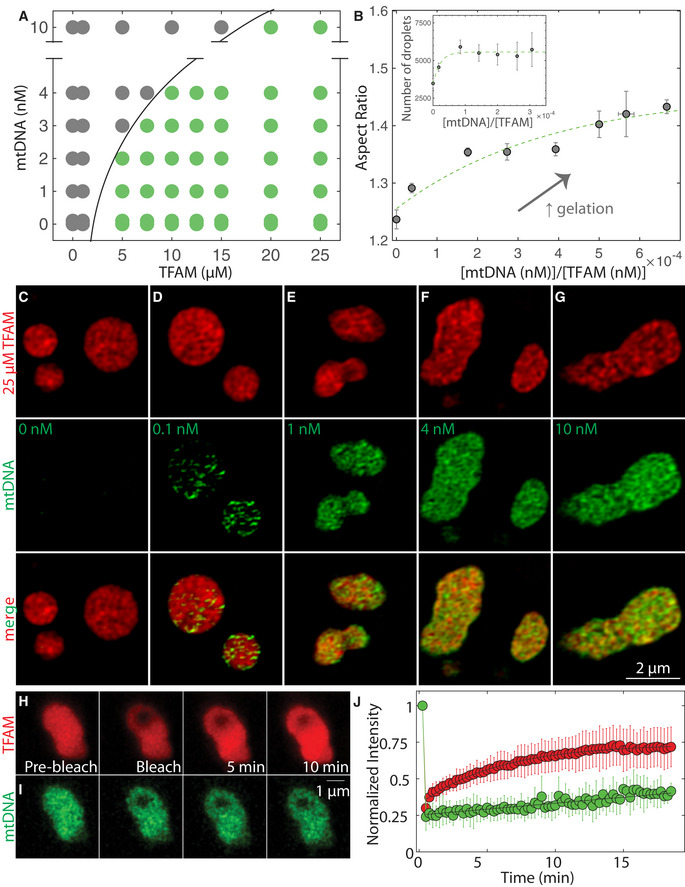
Phase diagram of mtDNA versus TFAM denoting single/soluble phase (gray) or two phases/droplets (green). Each point on the phase diagram representing a unique DNA and protein concentration was measured from n = 2–12 independent experiments. Black solid line delineates deduced phase boundary.
-
B
Aspect ratio as a function of dimensionless concentration (molar concentration mtDNA/molar concentration TFAM). Values represent binned mtDNA/TFAM conditions as measured in (A), and error bars are SEM. Green dashed line is an exponential fit to the data where . Inset: number of TFAM‐mtDNA droplets per field of view as a function of dimensionless concentration. Values represent binned conditions from mtDNA/TFAM conditions measured in (A) and error bars are SEM. Green dashed line is an exponential fit to the data where y = 5,600 – 2,100e
(−x/2.1).
-
C–G
SIM images of droplets 30 min after mixing with various amounts of mtDNA: 0 nM (C), 0.1 nM (D), 1 nM (E), 4 nM (F), and 10 nM (G). Top row is of TFAM‐DyLight‐594 (red), middle row is of mtDNA‐Alexa 488 (green) and bottom row is the merged image. Scale bar = 2 µm.
-
H, I
FRAP experiments on TFAM‐mtDNA droplets at 25 µM TFAM (H, red) and 10 nM mtDNA (I, green). Scale bar = 1 µm.
-
J
FRAP recovery curve showing intensity as a function of time for TFAM (red) and mtDNA (green). Black line are single exponential fits, where mobile fraction ≈ 0.60 and characteristic recovery time t ≈ 350 ± 30 s for TFAM (y = 0.73–0.38exp(‐t/350)), and recovery times t >> 15 min for mtDNA (error = 95% CI). Values represent averages ± SD from n = 16 droplets.

