-
A–H
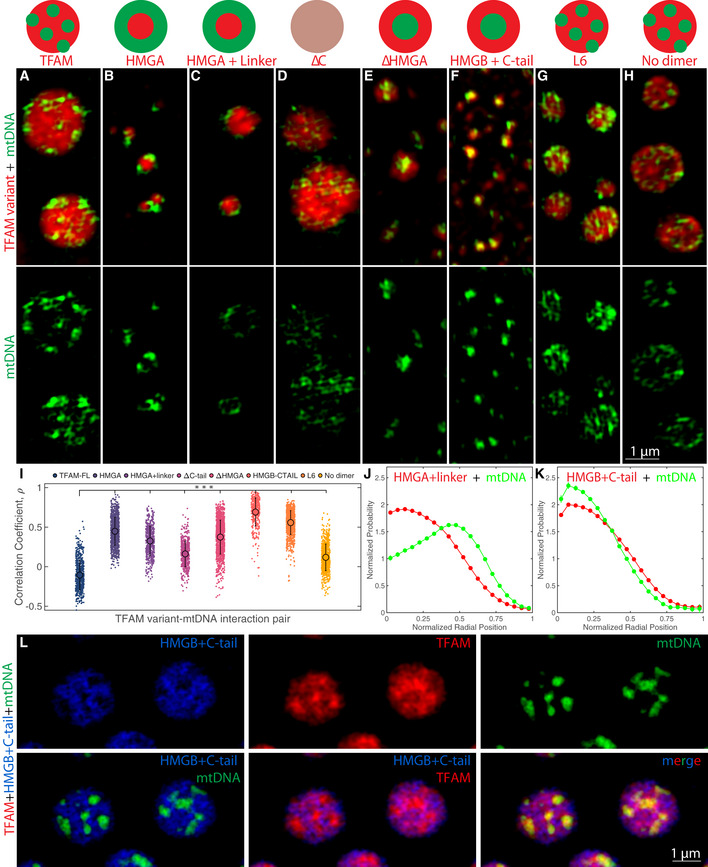
Single z‐slices of SIM images of TFAM mutants with mtDNA, where TFAM full‐length (A), HMGA (B), HMGA + linker (C), ΔC (D), ΔHMGA (E), HMGB + C‐tail (F), L6 (G), and no dimer (H). Final concentrations of TFAM mutants (red) and mtDNA (green) were each 25 µM and ~1 nM, respectively. Schematic diagram represents typical organization of TFAM mutant and mtDNA inside of droplet. Top panel of images is the merge of TFAM mutant and mtDNA channels, and the bottom panel of images is of the mtDNA channel only. Scale bar = 1 µm.
-
I
Correlation coefficient as a function of each TFAM mutant with mtDNA analyzed for the above images, where n = ~200–1,000 droplets. Error bars represent standard deviation (SD), and a one‐way ANOVA test was performed, where ***P < 0.001.
-
J, K
Radial distribution functions of the localization of HMGA + linker (J, red) or HMGB + C‐tail (K, red) and mtDNA (green) inside the droplet. Droplet dimensions were normalized where 0 is the center of the droplet and 1 is the periphery of the droplet.
-
L
Single z‐slices of SIM images of compound droplets containing HMGB + C‐tail (blue), TFAM (red), and mtDNA (green). Top row contains individual channels for HMGB + C‐tail, TFAM, and mtDNA, respectively. Bottom panel shows overlays, where the leftmost is of HMGB + C‐tail and mtDNA channels, middle panel is HMGB + C‐tail and TFAM, and rightmost panel is the three‐color overlay. Scale bar = 1 µm.

