-
A–C
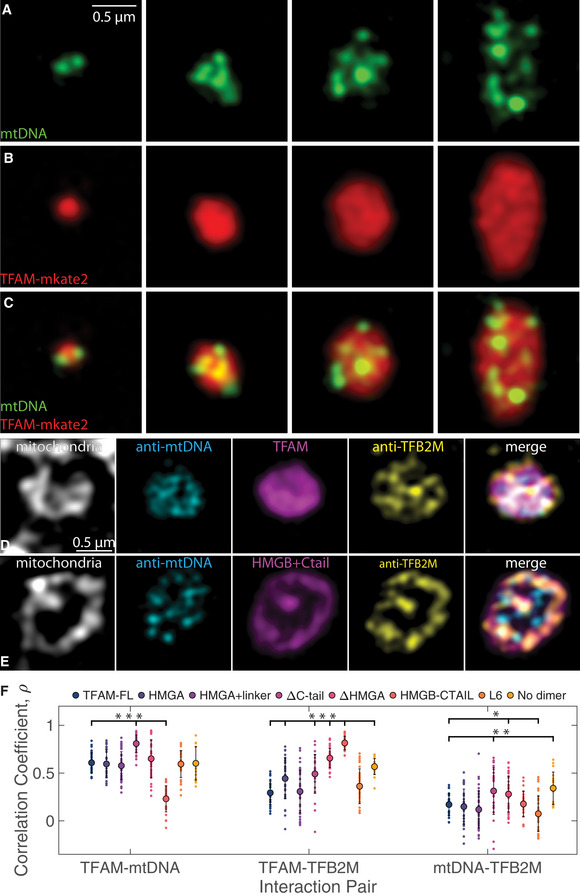
Single z‐slices of SIM images of individual mt‐nucleoids ranging in size after overexpression of TFAM‐mKate2 in a fixed HeLa cell, where mtDNA (A, green, anti‐DNA), and TFAM (B, red, TFAM‐mKate2) and merge (C). Scale bar = 0.5 µm. Each structure represents a single, enlarged mt‐nucleoid containing multiple mtDNA foci found in one mitochondrion.
-
D, E
Single z‐slices of SIM images of individual mt‐nucleoids in single mitochondria from fixed HeLa cells after TFAM‐mKate2 (D) and HMGB + C‐tail‐mKate2 (E) overexpression (magenta), where mitochondria are labeled with MitoTracker Far Red (gray), mtDNA is labeled with anti‐mtDNA (cyan), and TFB2M is labeled with anti‐TFB2M (yellow). Merged images are shown as an overlay of cyan, magenta, and yellow channels only. Each structure represents a single, enlarged mt‐nucleoid containing multiple mtDNA foci found in one mitochondrion. Scale bar = 0.5 µm.
-
F
Colocalization of channels is shown computed from Pearson’s correlation coefficient for each interaction pair shown for TFAM‐FL and all TFAM mutant constructs overexpressed in HeLa cells (n = 20–40 mt‐nucleoids from 4–5 cells imaged for each mutant construct). One‐way ANOVA analysis shows statistical significance across all mutants for each interaction pair, where P < 2e‐16 for TFAM‐mtDNA interactions, P < 2e‐16 for TFAM‐TFB2M interactions, and P = 1.3e‐8 for mtDNA‐TFB2M interactions. Error bars represent standard deviation (SD). Notation on graph denotes statistical analysis relative to TFAM‐FL based on the Least Significant Difference test for each interaction pair, where *P < 0.05, **P < 0.01, and ***P < 0.001.

