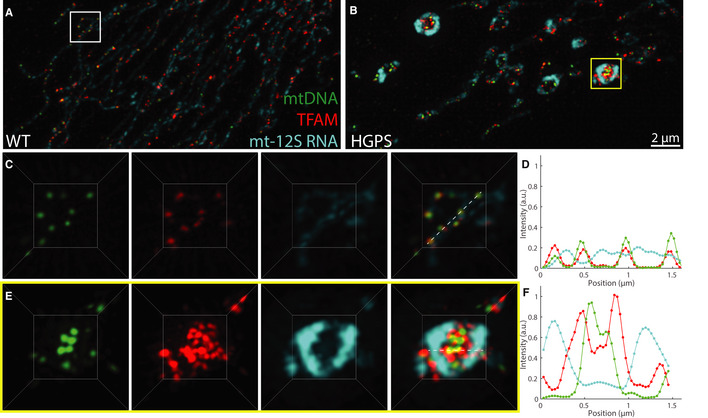
Figure 7. Functional features of enlarged mt‐nucleoids.

-
A, BMaximum intensity projections of SIM images of fixed normal (A) and HGPS (B) human skin fibroblasts, where mtDNA is in green with anti‐DNA, TFAM is in red with anti‐TFAM, and mt‐12S RNA is in cyan with RNA FISH. Scale bar = 2 µm.
-
CThree‐dimensional views of normal mitochondria annotated by the white box in (A) and showing individual channels and an overlay; box ≈ 3.5 × 3.5 µm.
-
DNormalized intensity distributions of mt‐nucleoids labeled with anti‐DNA (green), anti‐TFAM (red), and mt‐12S RNA FISH (cyan) corresponding to images from (C).
-
EThree‐dimensional views of swollen mitochondria annotated by the yellow box in (B) and showing individual channels and an overlay; box ≈ 3.5 × 3.5 µm.
-
FNormalized intensity distributions of mt‐nucleoids labeled with anti‐DNA (green), anti‐TFAM (red), and mt‐12S RNA FISH (cyan) corresponding to images from (E).
