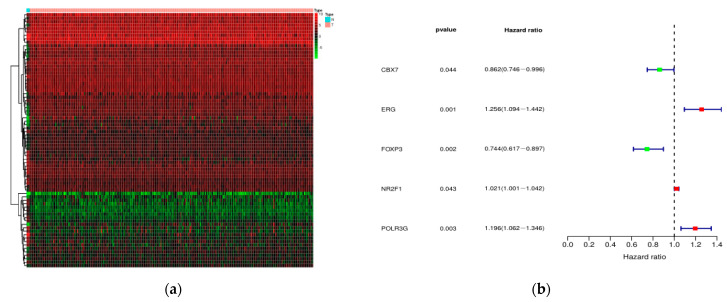
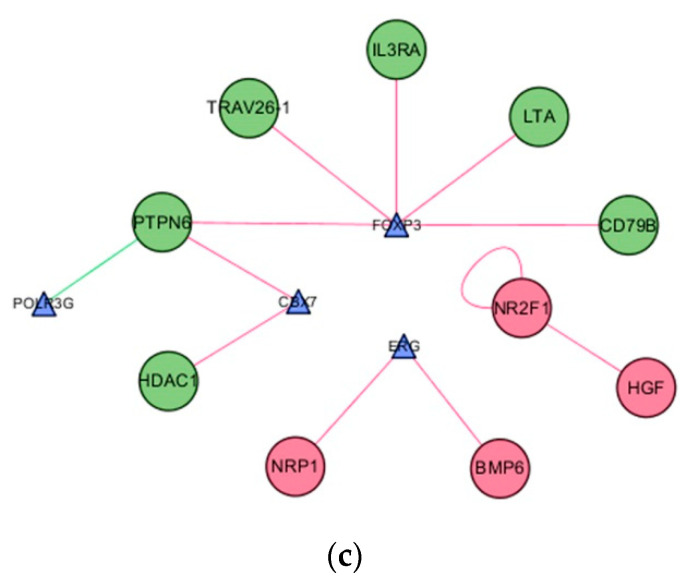
Figure 5.
The construction of a regulatory network between SDETFs and SIRGs. (a) Heatmap of the SDETFs. (b) A forest plot of hazard ratios. The left is the list of SDETFs and their prognostic values showing as name, p-value, and the hazard ratio (95% CI), and the right is the relevant forest plot. Green bar, protective factor; red bar, adverse factor. (c) A regulatory network between SDETFs and SIRGs. Triangle, TFs; Roundness, SIRGs; Red roundness, the overexpressed SIRGs; Green roundness, down-expressed SIRGs. Red line, the TFs up-regulate SIRGs; Green line, the TFs down-regulate SIRGs.


