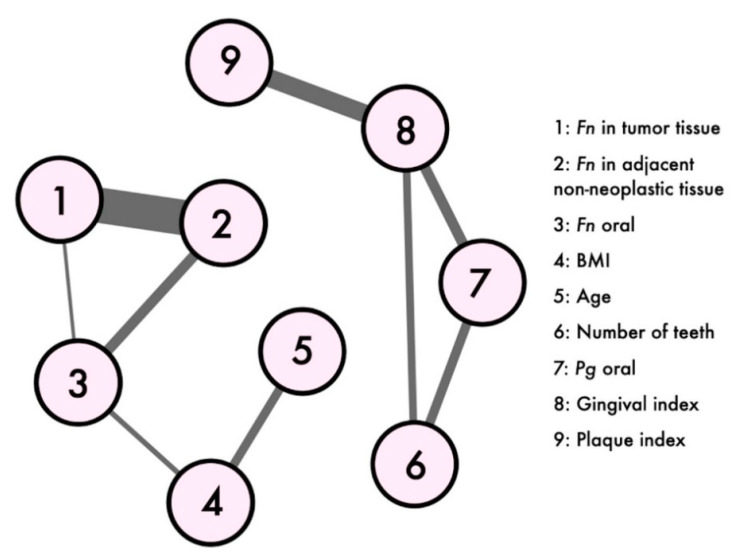
Figure 2.
Network plot. Network plot of the cancer patients variables, including the Fn and Porphyromonas gingivalis (Pg) quantities, oral health parameters, age and body mass index (BMI); labels are shown for weights over 0.24 Spearman correlation coefficients (rho). The thicker the line, the highest the weight of the correlation between the nodes. Nodes were positioned using the Fruchterman-Reingold algorithm. Density: 0.25, number of observations: 34 and missed values were excluded pairwise.

