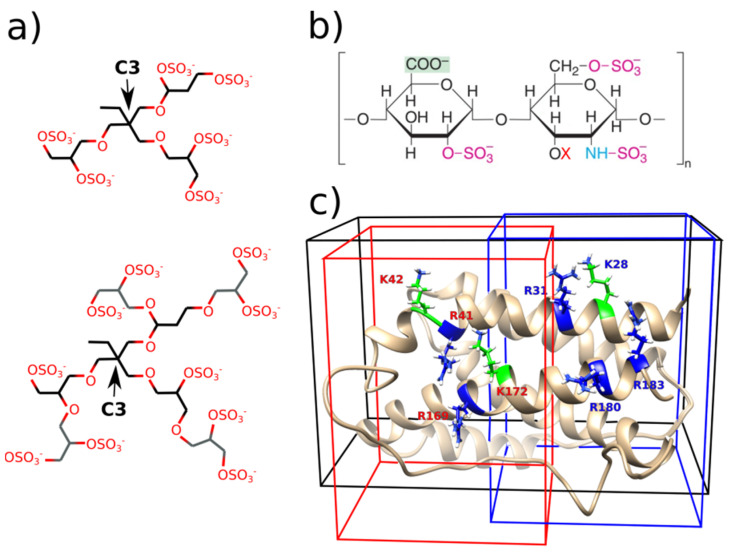
Figure 1.
(a) Sketch of the first and the second generation of the dPGS. Gray colored carbons are additional branches that mark the second generation. Indicated C3 atom is used in the analysis of the MD simulations; (b) Structure of the heparin disaccharide unit, red X marks the variably sulphated position, which means that X=H or SO3−. (c) Structure of hIL-6 with the highlighted amino acids used to define the binding sites and the corresponding docking boxes. Red labels and red colored box for RKRK site, and blue labels, blue colored box for KRRR site. Black box includes both binding sites RKRK&KRRR. Structures are not up to scale.

