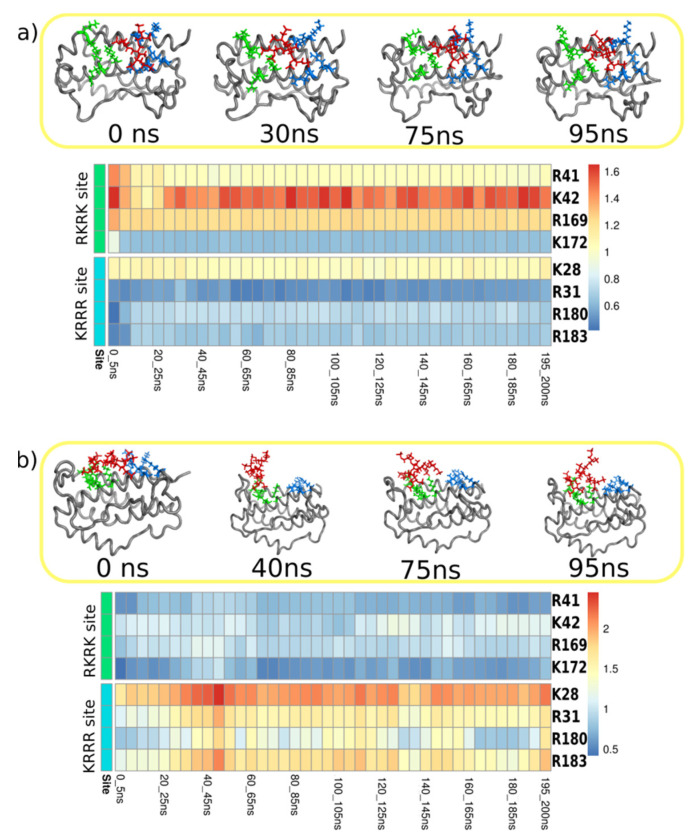
Figure 5.
Analysis of the MD simulations for two docked poses into RKRK&KRRR box: (a) dPGS of the first generation; and (b) dPGS of the second generation. Upper parts show snapshots from the MD, with IL6 colored grey, dPGS colored red, amino acids from RKRK site are green and amino acids from KRRR skyblue. Heat maps present analysis of the distances between central C3 atom of the dPGS and positively charged amino acids from RKRK (R41, K42, R169, K172) and KRRR (K28, R31, R180, R183) site during 200-ns MD. Heat map represents distances from 0.4 to 1.6 nm where blue color indicated shorter distances and red longer. This means that dPGS remains close to its initial position near the KRRR group of amino acids in the case of the first generation dPGS. The second generation dPGS remains close to the RKRK site amino acids.

