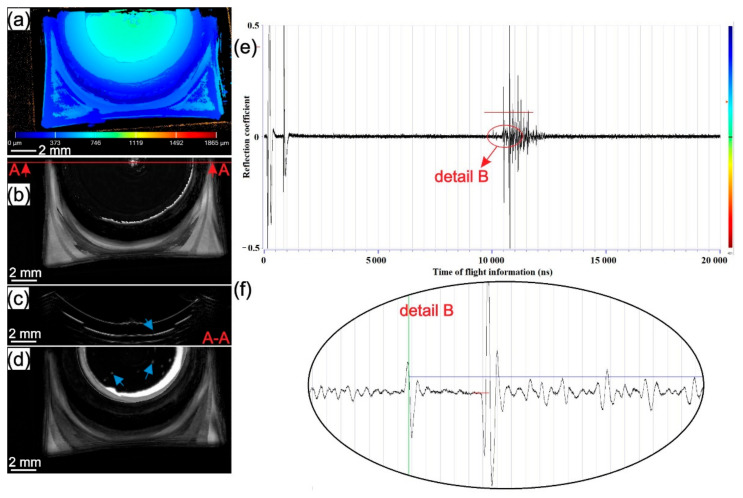
Figure 8.
The sample from batch II welded with 2500 rpm: (a) topography map from the top surface; (b) C-scan with gate position 20 ns and gate length 50 ns with A-A cross-section showing the place where B-scan was obtained; (c) B-scan from A-A cross-section; (d) C-scan with gate position 220 ns and gate length 50 ns as shown in detail B with red line on A-scan; (e) A-scan with detail showing the gate length of C-scan from (c); (f) detail of A-A scan from (e).

