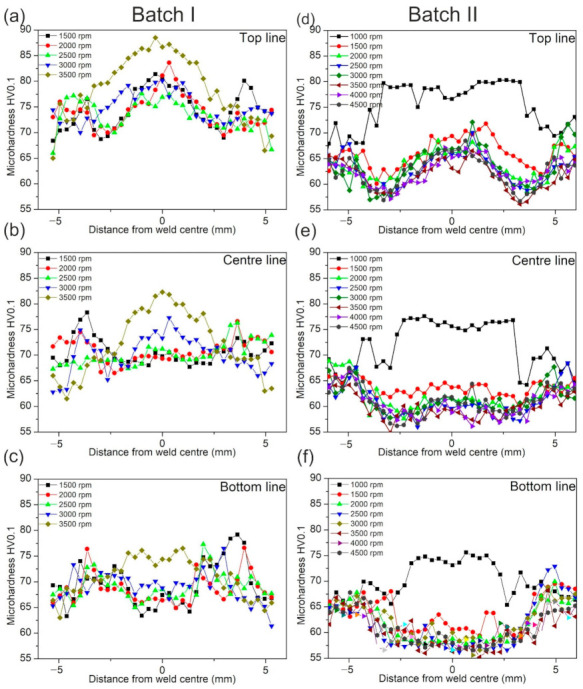
Figure 12.

Microhardness profile measured at the weld cross-sections: (a) hardness profiles from the batch I in the top line (0.9 mm from the bottom of the sample); (b) in the middle line (0.6 mm from the bottom of the sample) (c) in the bottom line (0.3 mm from the bottom of the sample); (d) hardness profiles from batch II in top line; (e) in the middle line; (f) bottom line.
