
Fig. 4 |. A primate striatal interneuron type not observed in mouse or ferret.
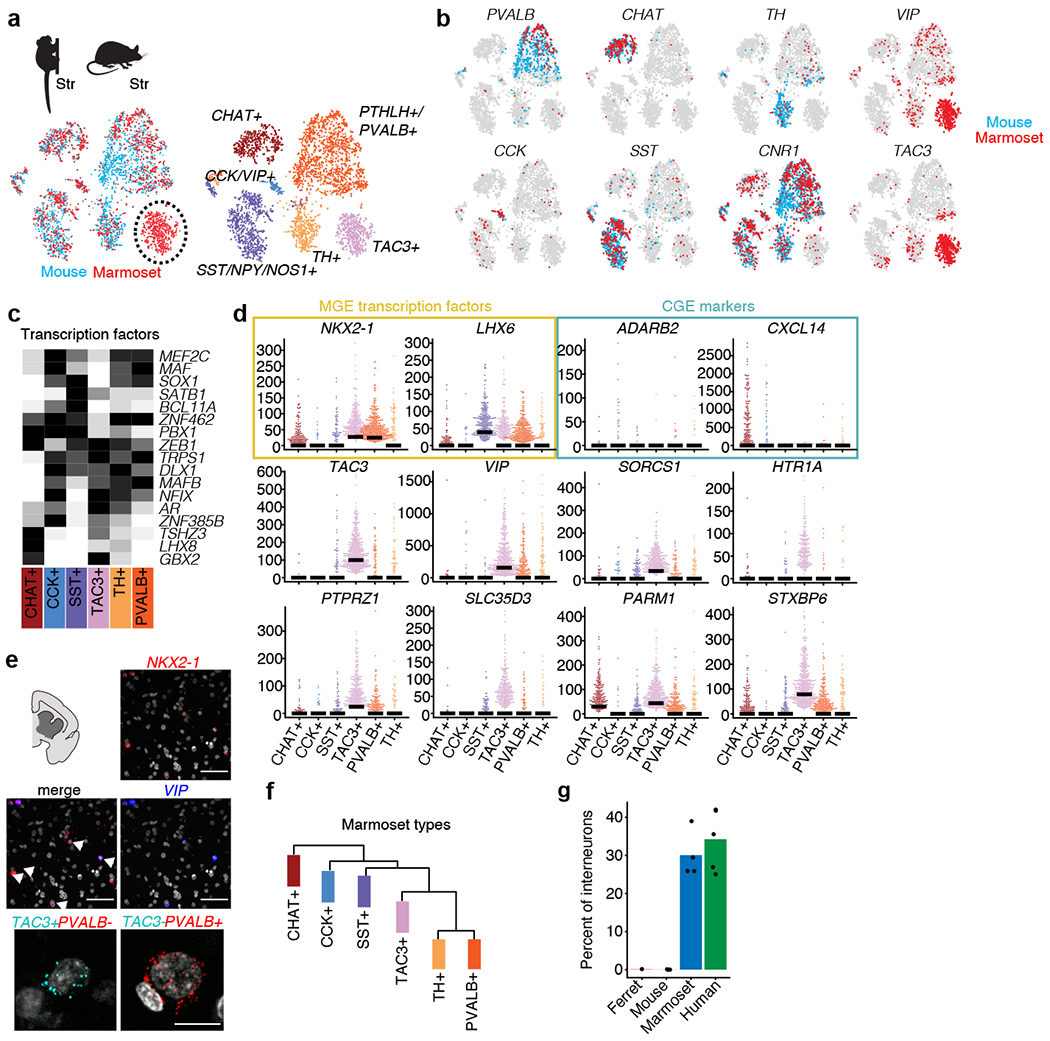
a, integrative cross-species alignment (using Liger) of marmoset (n = 2,227 interneurons) and mouse (n = 2,209 interneurons) striatal interneurons. Left, cells coloured by species (red, marmoset; blue, mouse). Right, cells coloured by cluster (cell type). b, Markers for each interneuron cluster plotted for marmoset (red) and mouse (blue). c, Heat map of transcription factors expression in marmoset striatal subtypes. Each gene is scaled to its maximum value across types (black, maximum value; white, minimum value). d, Beeswarm plots showing additional markers distinguishing TAC3+ interneurons from other interneuron types in marmoset, including MGE transcription factors (yellow) and CGE markers (blue). Dots are individual cells; bars indicate median expression. The y axes show the normalized expression of the indicated genes (number of transcripts per 100,000 transcripts). Top and middle, smFISH for VIP and NKX2-1 in marmoset striatum (n = 1 marmoset). Cells that co-express both genes are identified by arrows. Bottom, smFISH for TAC3 and PVALB identifies non-overlapping populations (n = 1 marmoset). Scale bars, 100 μm. f, Hierarchical clustering of marmoset striatal interneurons. g, Percentage of interneurons per species (out of the indicated total neurons; n = 702 ferret striatal interneurons, n = 2,209 mouse striatal interneurons, n = 3,284 marmoset striatal interneurons, n = 4,303 human striatal interneurons) assigned to the TAC3 cluster when integrated (by Liger) with marmoset data. Dots are individual replicates.