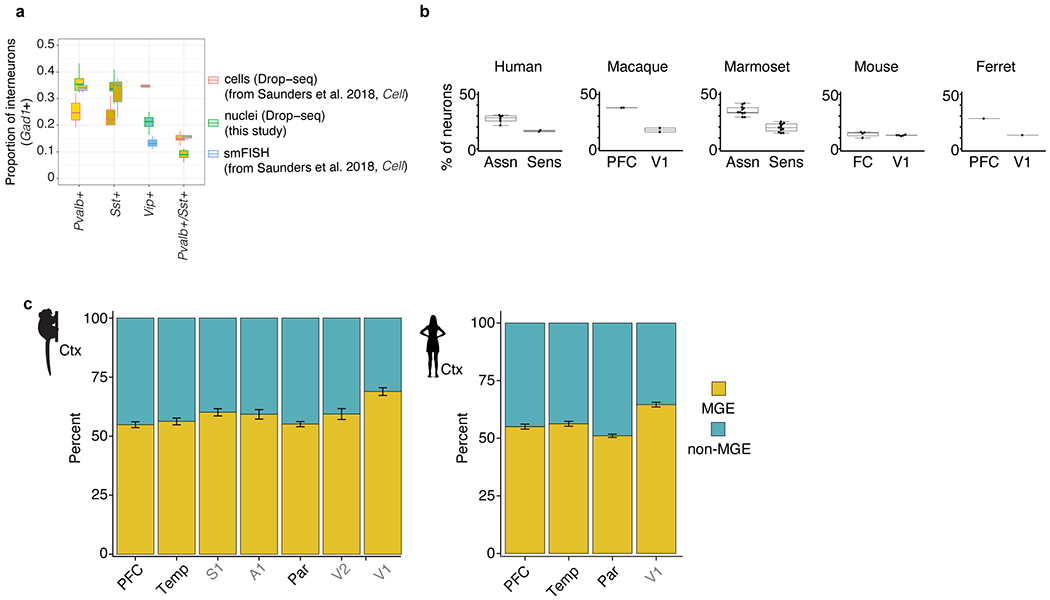
Extended Data Fig. 1 |. Interneuron abundances and gene expression in neocortex.

a, Comparison of measured abundances (expressed as the percentage of all Gad1+ cells) of select interneuron populations across three modalities: single-cell Drop-seq (n = 3,859 cells, n = 7 biological replicates), nucleus Drop-seq (8,622 nuclei, n = 11 biological replicates) and stereological counting of smFISH in mouse cortex (n = 3,891 counted cells, n = 3 biological replicates). Cell Drop-seq and smFISH values were obtained from a previous study15. Box plots show median and interquartile range. b, Percentage of interneurons (expressed as a percentage of all neurons) in sensory and association cortex measured with snRNA-seq. Box plots show the median and interquartile range; dots indicate individual brain regions. Ferret, n = 20,285 neurons; mouse, n = 90,159 neurons; marmoset, n = 576,345 neurons; human, n = 303,733 neurons. c, Proportion of MGE and non-MGE interneurons in cortical association regions (PFC, temporal pole and lateral parietal association cortex) and in cortical sensory regions in marmoset (n = 25,946 interneurons across 7 regions from 1 replicate) and human (n = 42,042 interneurons across 4 regions from 2 replicates). Error bars represent binomial confidence intervals.
