
Extended Data Fig. 4 |. Regional gene expression variation in neocortex.
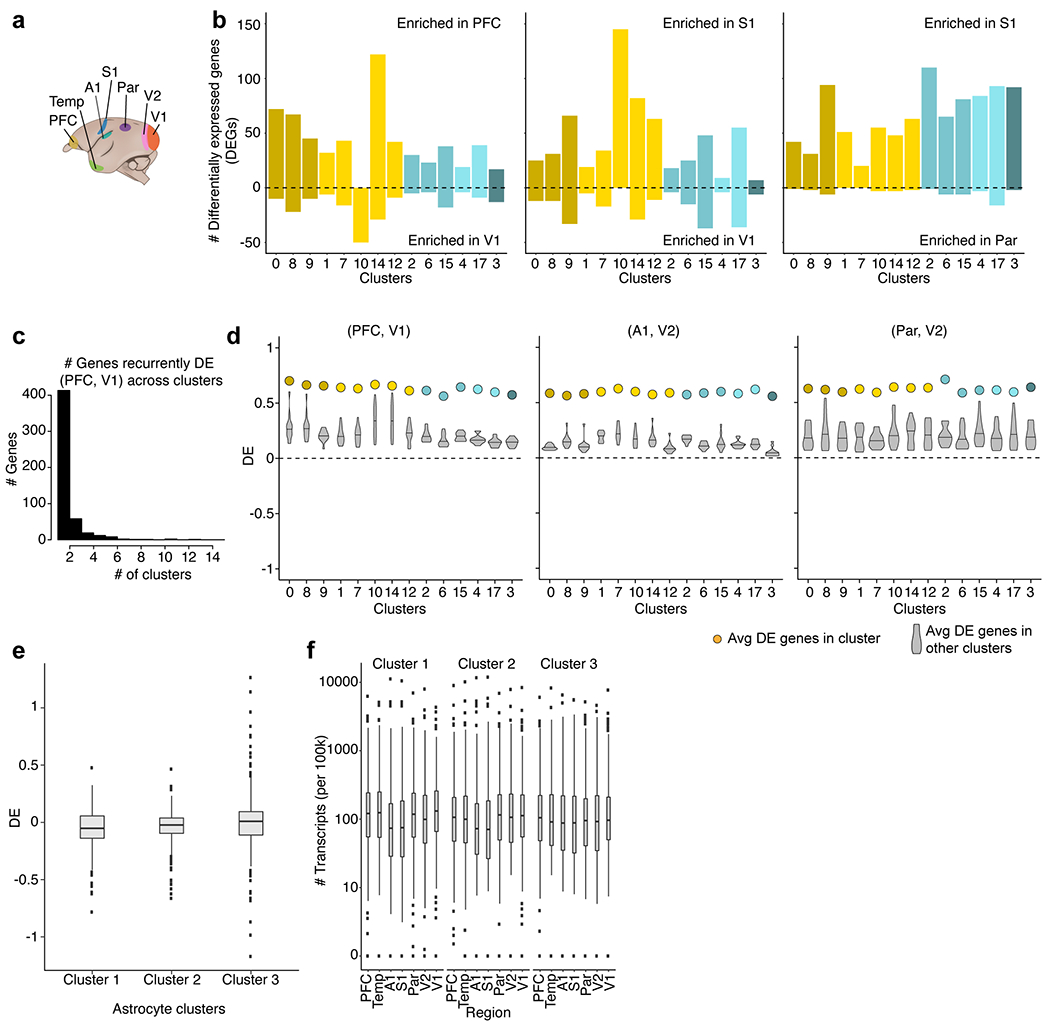
a, Schematic of neocortical region locations in marmoset. b, Histogram of the number of rDEGs (>3-fold expression difference) between three representative pairs of regions, in each cell type (cluster) for which there were at least 50 cells per region. c, Histogram of the number of interneuron clusters (cell types) in which a given gene is differentially expressed. At a threshold of >3-fold, most genes are only differentially expressed in a single cell type (cluster). d, Average fold difference of regional enrichment across regions and clusters. Coloured dots represent average fold difference of DEGs in each cluster in marmoset interneurons computed from the region pair depicted. Violin plots represent the distribution of average fold differences in each cluster (cell type) when using rDEGs from other clusters. Three representative region pairs are shown (n = 517 rDEGs genes across clusters for PFC and V1; n = 2,271 genes for A1 and V2; n = 1,622 genes for Par and V2). Horizontal bars on violin plots represent the median differential expression score (when using rDEGs from other clusters). rDEGs identified for any one interneuron type (cluster) tended to also exhibit the same regional bias in the other types (clusters). This suggests that most such differences reflect a common regional signature that is shared by diverse interneurons, rather than being specific to particular interneuron types. e, Fold ratios (log10-transformed) between PFC and V1 for three astrocyte subtypes (n = 32,600 nuclei) in marmosets using rDEGs identified in interneurons in the same brain regions. Box plots show interquartile ranges and medians. Dots show outlier genes. f, As in e but for all seven brain regions. Regions are arranged in anterior–posterior order on the x axis. Box plots show interquartile ranges and medians. Dots show outlier genes.