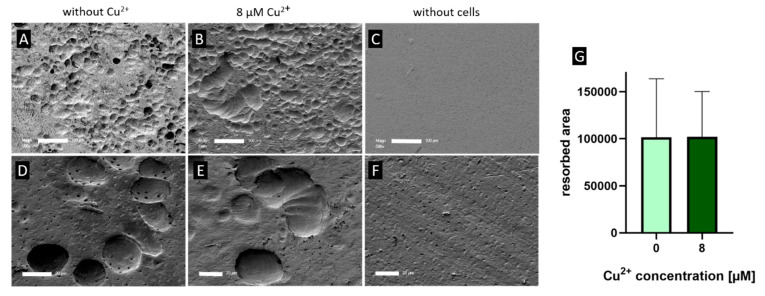
Figure 5.
Representative SEM images of resorption pits after 14 days cultivation of PBMC derived osteoclasts on dentine slices (A,D) control, (B,E) 8 µM Cu2+, (F,G) without cells, scale bar represent 100 µm (A–C) and 20 µm (D–F). (G) Open source Fiji software was used to calculate resorbed area of dentin slices (cells of two PBMC donors, 24 images per group). For details see Supplemantary Figure S2. Mann-Whitney did not reveal significant differences between 0 and 8 µM Cu2+.

