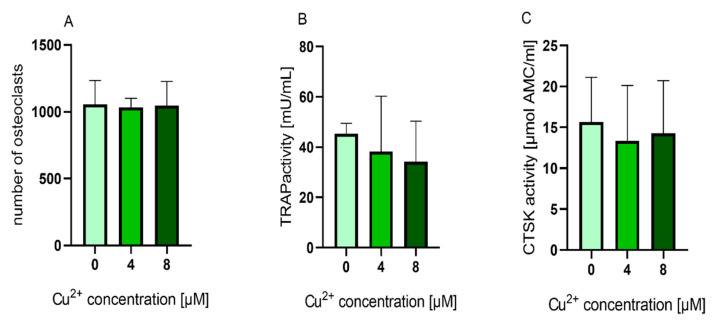
Figure 8.
(A) Number of multinucleated TRAP positive osteoclasts counted from light microscopic images (cells of two donors, 4 images per condition) Statistic differences were calculated by one-way ANOVA, followed by Tukey’s test for multiple comparisons (B) TRAP activity and (C) CTSK activity of mature osteoclasts cultivated in the presence of 0, 4 and 8 µM Cu2+. Data of four different donors were included into the calculation with each n = 3 replicates per group (average +/− standard deviation). TRAP and CTSK activities were normalized to the copper free control, since the enzyme activity levels between the different donors showed high variances. Statistical significant differences were calculated by one way ANOVA followed by Tukey’s test to perform multiple comparisons. * p < 0.05 compared to the control.

