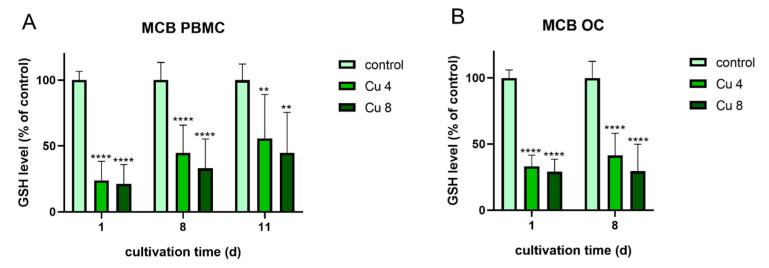
Figure 10.
Glutathione levels of PBMC during osteoclastic differentiation (A) and of mature osteoclasts (B) in the presence of 4 and 8 µM Cu2+ compared to a copper-free control. Data of three different PBMC donors (each n = 3; n = 9 in total per group and time point) were included into the calculations. Statistically significant differences were calculated by 2-way ANOVA followed by Tukey’s multiple comparisons test * p < 0.05, ** p < 0.01, *** p < 0.001, **** p < 0.0001.

