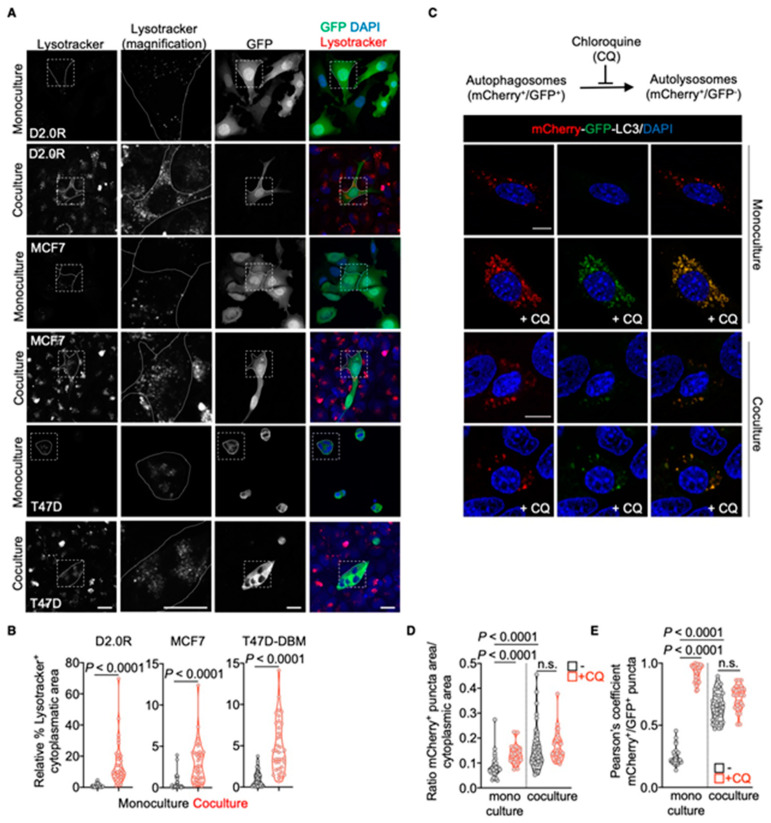
Figure 2.
Accumulation of lysosomal vesicles in cocultured DDCCs. (A) Lysosomal accumulation in D2.0R-EGFP, MCF7-EGFP and T47D-DBM-EGFP cells upon monoculture or coculture with AT1-like cells as visualized by Lysotracker staining. Dashed box: area magnified in the middle images. Scale bar: 20 μm. (B) Quantification of the relative cytoplasmic area with Lysotracker+ staining. Mann-Whitney test. n = 3 independent experiments. (C) Representative pictures of mCherry and GFP fluorescent signals in D2.0R cells transfected with mCherry-GFP-LC3 tandem construct upon monoculture or coculture. Scale bar: 20 μm (monoculture), 15 μm (coculture). (D) Cytoplasmic area with mCherry+ve puncta in cells showed in (C). Kruskal–Wallis test, multiple comparisons. n = 2 independent experiments. (E) Colocalization of mCherry+ve and GFP+ve signals in cells showed in (C) expressed with Pearson’s correlation coefficient. Kruskal–Wallis test, multiple comparisons. n = 2 independent experiments.

