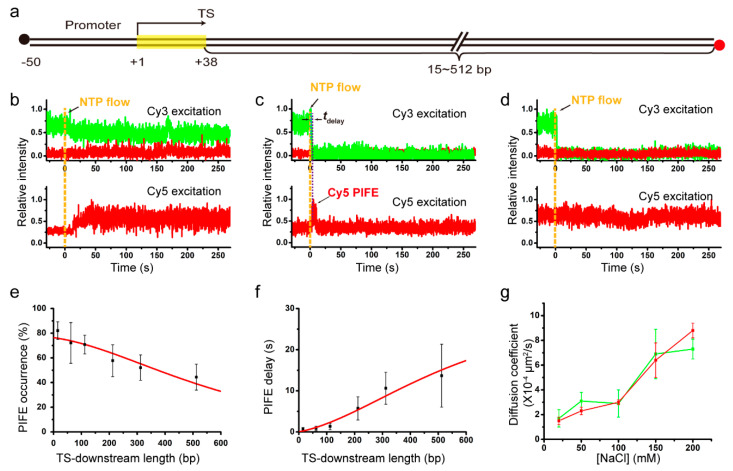
Figure 2.
(a) DNA with varying length of TS-downstream part. Template DNAs were labeled with Cy5 at the downstream end and immobilized using biotin (black) at the upstream end. Transcript RNAs were nascently labeled with Cy3 at the 5’ end. (b–d) Representative fluorescence traces were taken from complexes with DNA template L+212. The Cy3 (green) and Cy5 (red) signals were obtained from Cy3 (top) and Cy5 (bottom) excitations on individual complexes of readthrough at TS (b), termination at TS with subsequent Cy5 PIFE (c), and termination at TS without Cy5 PIFE (d). Yellow vertical lines indicate NTP injection timing. PIFE delay (tdelay) in (c) is the time difference between Cy3 vanishing and Cy5 PIFE starting. (e) PIFE occurrences plotted against TS-downstream lengths from the experiments with 150 mM NaCl. The occurrence data (black squares) fit to a 1D diffusion model (red line). (f) PIFE delays plotted against TS-downstream lengths from the 150 mM NaCl experiments. The delay data (black squares) fit to a 1D diffusion model (red line). (g) The 1D diffusion coefficients estimated using the PIFE occurrence data (red) and PIFE delay data (green) are plotted against NaCl concentrations.

