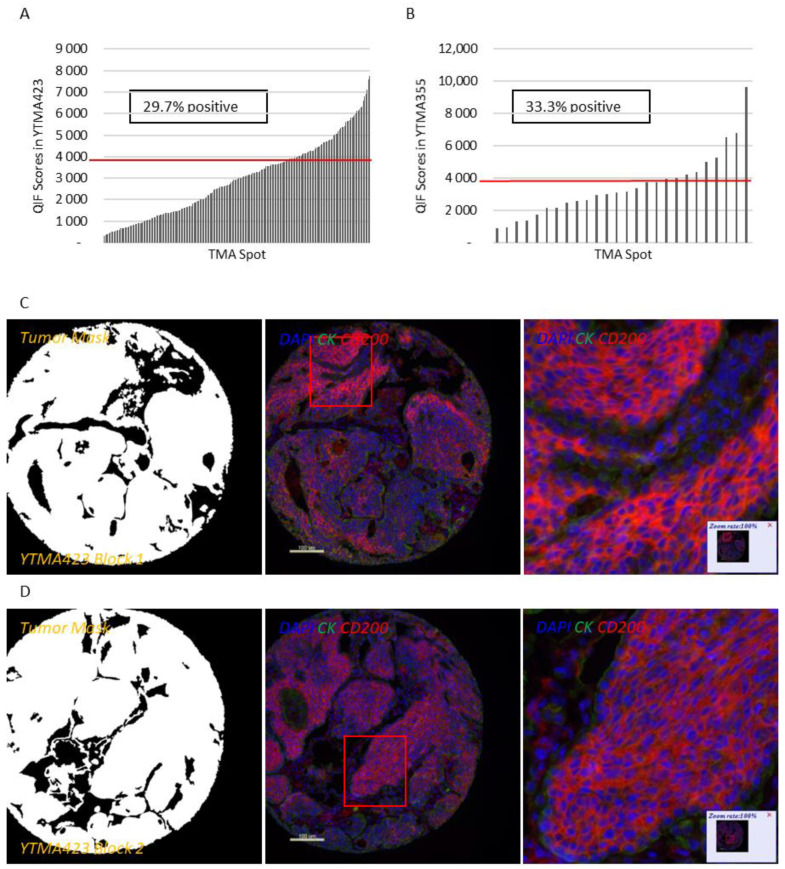
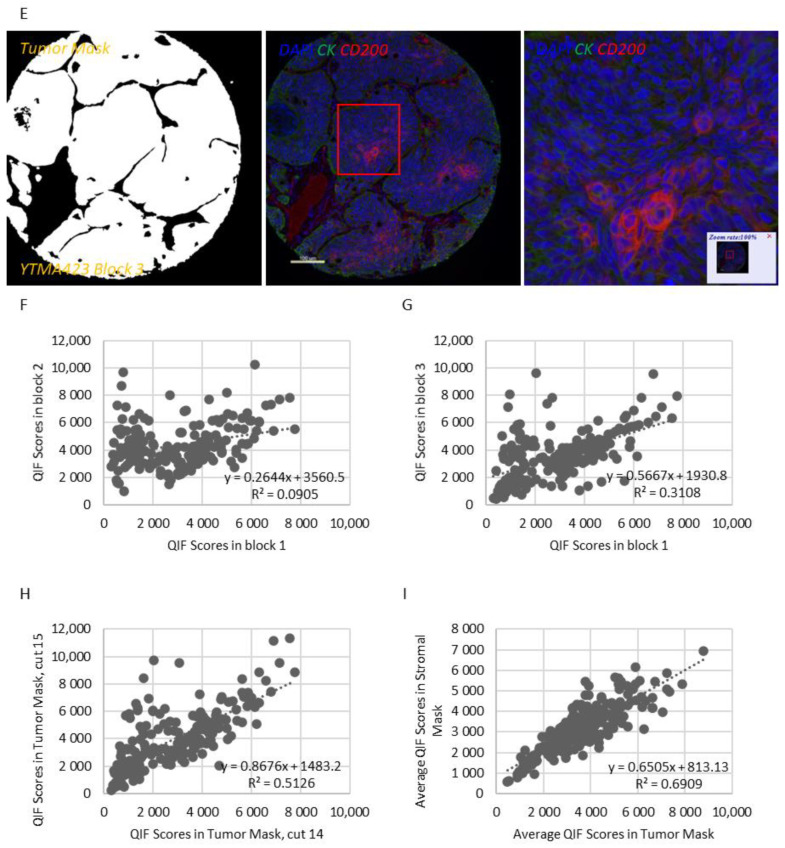
Figure 1.
Patterns of expression and distribution of CD200 in lung cancer. (A,B) Dynamic range charts that depict CD200 expression within the tumor compartment in non-small cell lung cancer (NSCLC) (A) and large cell neuroendocrine carcinoma (LCNEC) (B) patients. Red lines represent the visual cutoffs that were used to define CD200 positive cases. (C–E) Different cores from the same representative NSCLC case, stained in YTMA423 blocks 1 (C), 2 (D) and 3 (E). (F–I) Scatter plots indicative of intratumoral heterogeneity of CD200 in NSCLC. Scatter plots of YTMA423 block 1 versus block 2 (F) and block 3 (G). Scatter plot between serial cuts of YTMA423 block 1 (H). Scatter plot between tumor and stromal expression of CD200 on the same cut (I). Abbreviations; DAPI, 4′,6-diamino-2-phenylindole; CK, Cytokeratin.


